ARMCO’s Mortgage QC Industry Trends Report represents an analysis of quality control findings throughout the United States using extensive data derived from the ACES Analytics benchmarking software. This report is designed to provide business leaders and mortgage quality control professionals meaningful information on nationwide loan quality trends.
Executive Summary
QC Industry Trends – Overview
QC Industry Trends – by Category
QC Industry Trends – by Loan Purpose
QC Industry Trends – by Loan Type
Conclusion
About this Report
Executive Summary
This report presents industry trends in mortgage quality control for the first quarter of 2016 based on analysis of loan files and defects captured in the ACES Analytics benchmarking system. The ACES Analytics benchmarking dataset includes post-closing quality control data from over 60 lenders, comprising more than 50,000 unique loans. Defects are categorized using the Fannie Mae loan defect taxonomy. An analysis of top-ranking defect categories from the beginning of 2015 through the first quarter of 2016 shows that Loan Package Documentation and Legal/Regulatory/Compliance continue to be the leading defect categories. However, these two categories are trending in opposite directions.
Report highlights include:
- In Q2 2015, the industry experienced a substantial dip in critical defects, dropping below 1%. This dip has reversed through the most recent two quarters.
- Loan Package Documentation defects continue to be one of the most frequently occurring individual defect categories, although trending lower.
- TRID continues to impact overall defect rates, most specifically the Legal/Regulatory/Compliance defect category.
QC Industry Trends - Overview
Figure 1 displays the overall percentage of critical defects by quarter. According to ACES Analytics data, the industry experienced a significant decrease in defects through Q2 2015 but has dramatically increased over Q4 2015 and Q1 2016.
“Due in part to the agency and regulatory focus on lending quality and consumer protections, the mortgage industry has seen a dramatic improvement and standardization of how critical defects are being identified and reported. It would be difficult to overstate the significant role served by technology investments that have enabled lenders’ a deeper insight into their processes and manufacturing defects.” said Phil McCall, COO at ACES Risk Management, ARMCO.
Critical Defect Rate, Q2 2015 – Q1 2016

Figure 1: Percentage of all critical defects by quarter
QC Industry Trends – By Category
Figure 2 shows a breakdown of the Fannie Mae defect categories and the percentage of defects found for 2015 in comparison to Q1 2016. The two categories with the highest level of defects in 2015 were Loan Package Documentation and Legal/Regulatory/Compliance. As our analytics show, these two categories remain the top two defect categories; however, the categories are trending in different directions.
In 2015, Loan Package Documentation accounted for over 35% of the overall defects. This area of the manufacturing process appeared to be a point of failure for many lenders and echoes information shared by Freddie Mac at the Mortgage Bankers Association’s (MBA’s) National Technology in Mortgage Banking Conference & Expo 2016. Freddie Mac noted Loan Package Documentation as their leading area of defects, accounting for 28% of all defects reported in 2015*.
The data reported by our lender base clearly shows that a concerted effort has been made to take corrective action for Loan Package Documentation, resulting in a 25% decrease in defects in this area being reported in the first quarter of 2016.
In 2015, the Legal/Regulatory/Compliance category trailed right behind Loan Package Documentation, accounting for just under 26% of defects. As the TILA-RESPA Integrated Disclosure (TRID) requirements went into effect in October 2015, the dramatic increase in reported defects for the Legal/Regulatory/ Compliance category can be directly associated with lenders struggling with the implementation, interpretation and compliance of the new TRID regulations and, as of Q1 2016, accounted for 50% of reported defects.
*Chris Mock, “Data for Risk Management & Quality Control,” MBA’s National Technology in Mortgage Banking Conference & Expo 2016, Los Angeles, CA, April 4, 2016
Defect Rates by Fannie Mae Category, 2015 v. Q1 2016
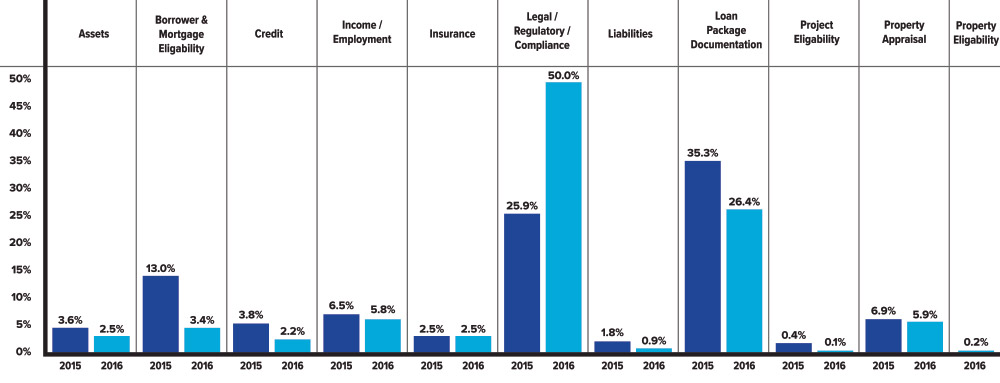
Figure 2: Breakdown of defects by Fannie Mae categories for 2015 and Q1 2016.
Figure 3 highlights a focused breakdown of the Loan Package Documentation defect category by the percentage of defects found in 2015 compared to Q1 2016. Loan Package Documentation has seen an impressive decrease in reported defects. Based upon our discussions with many lenders, corrective action planning has been at the heart of reducing the defects associated with Loan Package Documentation. Lenders have been able to systemically identify the root cause of these defects and establish touch points through the manufacturing process to ensure the required documents are properly identified and included in the final loan package.
Loan Package Documentation, 2015 v. Q1 2016
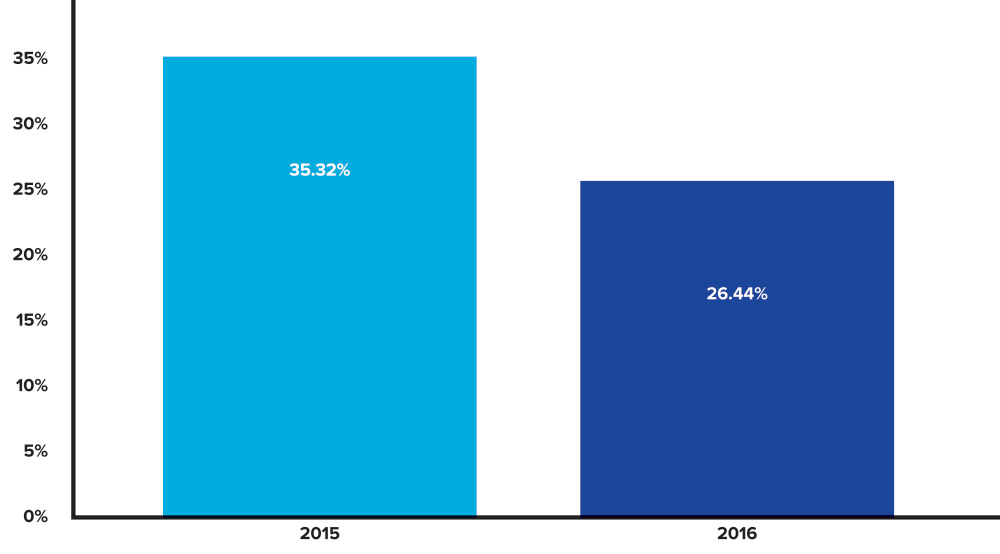
Figure 3: Breakdown of defect category Loan Package Documentation 2015 v. Q1 2016.
Figure 4 provides a trending view of the Loan Package Documentation defect category by the percentage of defects found for the past four quarters. As the top defect category in 2015, the data provides clarity on the fact that lenders acknowledged this problem and are taking corrective action. Overall, this category has seen a quarter-by-quarter decrease, dropping below 27% of all defects in Q1 2016.
Loan Package Documentation Defects, Q2 2015 – Q1 2016
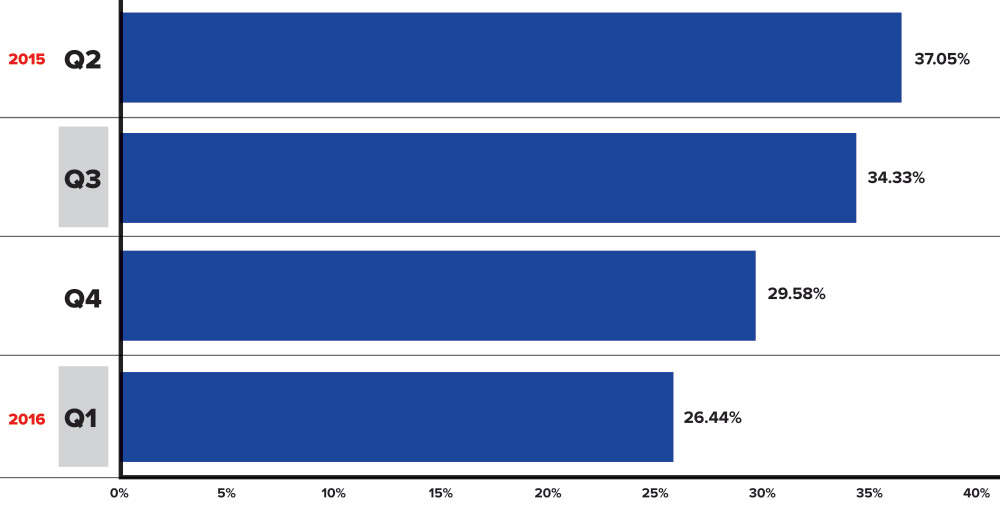
Figure 4: Breakdown of defect category Loan Package Documentation by quarter.
Figure 5 shows a breakdown of the Legal/Regulatory/Compliance defect category, with defects in this area almost doubling in Q1 2016 as compared to 2015. A key deficiency in this category that has been identified by many lenders is errors and omissions on the Closing Disclosure (CD). A large number of these defects are directly attributed to the creation of the CD by lenders rather than by settlement agents, who historically had performed this function. It became apparent in early January that lenders’ closing departments were ill equipped with knowledge and a fundamental understanding of the complete settlement process, which includes realtors and sellers as participants in many transactions. This was a new fundamental process industry-wide and in hindsight, many lenders feel they should have partnered with their primary settlement agents to assist with the learning curve prior to implementation.
Legal/Regulatory/Compliance, 2015 v. Q1 2016
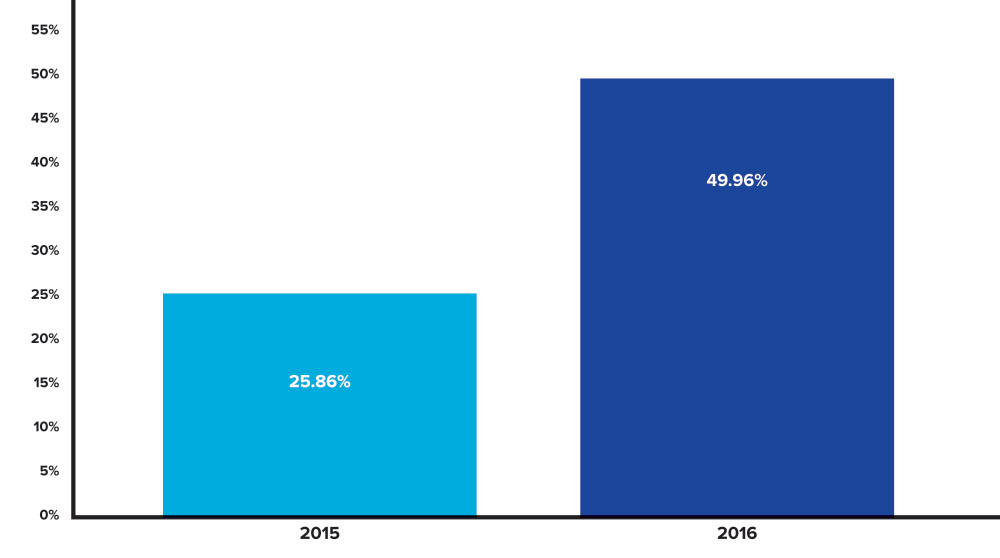
Figure 5: Breakdown of defect category Legal/Regulatory/Compliance 2015 v. Q1 2016.
Figure 6 shows a quarterly breakdown of Legal/Regulatory/Compliance defects. A noticeable increase in Q4 2015 and Q1 2016 can be directly attributed to the TRID requirements. The increase in TRID defects accounted for a more than 50% jump in reported defects from Q3 to Q4 2015 and then again from Q4 2015 to Q1 2016. Defects associated with the CD make up the vast majority of this increase in Legal/Regulatory/Compliance defects. In addition to the noted area of conducting a work task previously handled by settlement agents, lenders were also tasked with providing proper disclosure to not only the loan applicants, but also to all parties with an ownership interest, trustees, and/or parties with powers of attorney. Both lenders and LOS systems struggled with ways in which to identify, disclose, and track delivery and receipt of the CD to these parties. Industry-wide, it generally took the entire first quarter to become compliant, if not proficient, in ensuring all delivery and timing requirements, including earliest closing dates, were met.
Legal/Regulatory/Compliance Defects, Q2 2015 – Q1 2016
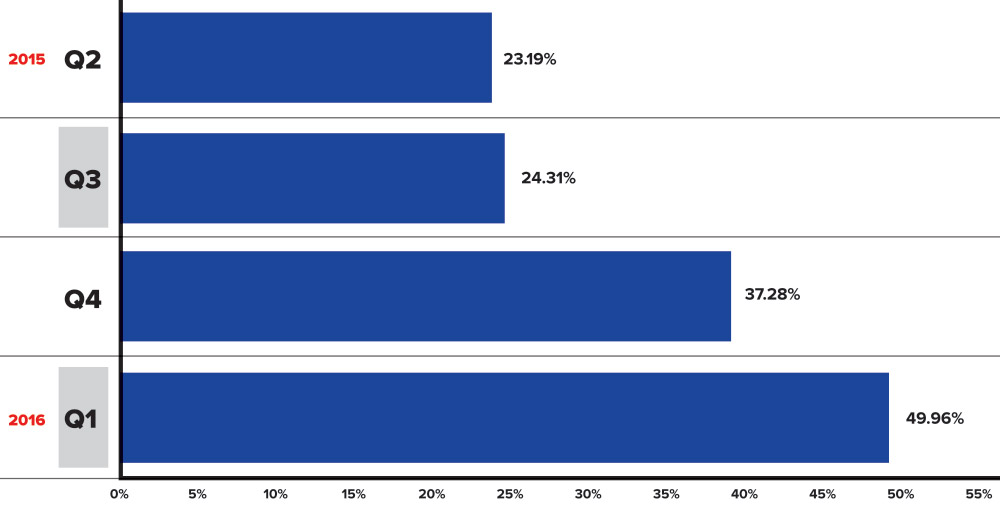
Figure 6: Breakdown of defect category Legal/Regulatory/Compliance by quarter
Conclusion
The quality control trends outlined in this report provide insights primarily on the two defect categories responsible for more than 75% of all defects – Loan Package Documentation and Legal/Regulatory/Compliance. The QC process for Q2 2016 is well underway, and lenders will be tracking their continued progress in identifying problem areas, such as Loan Package Documentation defects, and continue implementing remediation process to maintain the downward trend in reported defects over the past 12 months. Even more compelling will be the corrective action, training initiatives and enhanced procedures being implemented to modify the processes that were deficient through Q1 in properly identifying, interpreting and complying with the new TRID requirements.
About the ARMCO Mortgage QC Industry Trends Report
The ARMCO Mortgage QC Industry Trends Report represents post-closing quality control analysis through the United States using data and findings derived from mortgage lenders utilizing the ACES Analytics benchmarking software. This report provides an in-depth analysis of residential mortgage defects as reported during post-closing quality control audits. Data presented is comprised of the net critical defects and is in accordance with Fannie Mae taxonomy.
About ARMCO
ARMCO – ACES Risk Management delivers web-based audit technology solutions, as well as powerful data and analytics, to the nation’s top mortgage lenders, servicers, investors and outsourcing professionals. A trusted partner devoted to client relationships, ARMCO offers best-in-class quality control and compliance software that provides U.S. banks, mortgage companies and service providers the technology and data needed to support loan integrity, meet regulatory requirements, reduce risk and drive positive business decisions. ARMCO’s flagship product, ACES Flexible Audit Technology®™, is available at any point in the mortgage loan lifecycle, to any size lender, and is user-definable. ACES standardizes audit requirements, ties pre-funding reviews to post-closing quality control audits, enables seamless trend analysis, identifies credit, compliance and process deficiencies and helps create manageable action plans. For more information, visit www.acesquality.com or call (800) 858-1598.
MEDIA CONTACT:
Depth Public Relations
Telephone: 301-337-8477
Email: kerri@depthpr.com
