ACES’ Mortgage QC Industry Trends Report represents an analysis of nationwide quality control findings based on data derived from the ACES Quality Management & Control Software.
Executive Summary
QC Industry Trends – Overview
QC Industry Trends – by Category
QC Industry Trends – by Loan Purpose
QC Industry Trends – by Loan Product Type
Economic Discussion
Conclusion
About this Report
Executive Summary
This report represents an analysis of post-closing quality control (QC) data derived from loan files analyzed by the ACES Quality Management and Control® benchmarking system during the first quarter of 2024 (Q1 2024). The report incorporates data from prior quarters, where applicable.
Findings for the Q1 2024 Trends Report were based on quality control data from tens of thousands of unique records. Volumes are essential to this analysis, and the included records reflect trends in overall origination volumes. However, data from additional lenders is added to this analysis once the lender’s QC review seasoning within the ACES software reaches the 12-month bar. Therefore, the overall volume in the QC Trends Report does not precisely mirror the overall market. All reviews and defect data evaluated for this report were based on post-close loan audits selected by lenders for full file reviews.
Defects are categorized using the Fannie Mae loan defect taxonomy. Data analysis for any given quarter does not begin until 90 days after the end of the quarter to allow lenders to complete the post-closing quality control cycle, resulting in a delay between the end of the quarter and our publication of the data.
NOTE: A critical defect is defined as a defect that would result in the loan being uninsurable or ineligible for sale. The critical defect rate reflects the percentage of loans reviewed for which at least one critical defect was identified during the post-closing quality control review. All reported defects are net defects.
Summary of Findings
The overall critical defect rate rose to 1.58%. Although modest, the increase ends five quarters of decline. While defects improved substantially in two of the four major underwriting categories, a sharp rise in Credit-related defects offset those improvements. Purchase review share edged up slightly while defect share declined. The opposite holds true for refinances, as review share declined while defect share increased. Looking at the breakdown by product type, review share decreased for FHA and USDA loans, while conventional and VA review share increased. Performance-wise, FHA and VA defects improved considerably this quarter, and conventional defects increased significantly.
Highlights include the following findings:
- The overall critical defect rate increased 3.27% to 1.58% in Q1 2024, ending five quarters of decline.
- While Income/Employment remains the leading category of defects, performance improved tremendously quarter-over-quarter in this category.
- Defects increased in two of the four major underwriting categories, with Credit defects nearly doubling from Q4 2023.
- Legal/Regulatory/Compliance defects increased by 208.37% to 16.22%, becoming the second-highest category of defects this quarter, followed by Loan Documentation at 14.41%.
- Insurance defects, while usually negligible, comprised 8.11% of all defects.
- Although refinance review share declined this quarter, defect share doubled, indicating a degradation in quality in this area.
- Defect share outstripped review share for conventional loans this quarter, most certainly fueled by the surge in refinance defects.
- Both review share and defect share declined in the FHA category. Lenders also saw substantial improvements in VA defect share despite significantly increasing review share over Q4.
QC Industry Trends – Overview
Despite the increase, this quarter’s critical defect rate of 1.58% still ranks amongst the lowest rates observed throughout this report’s history. However, mortgage originations for Q1 2024 dropped 6.8% from the prior quarter, reaching the lowest level since 20001. Thus, to observe an increase during a record-low quarter for origination activity is troubling.
In the current market, this kind of drop in origination volume often corresponds with a rise in interest rates, but that was not necessarily the case in Q1. After peaking in late October 2023, rates fell throughout the remainder of Q4, entering Q1 at 6.62% and remaining relatively stable through January, reaching as low as 6.6% by mid-month. By the end of February, rates peaked for the quarter at 6.94% before declining slightly to end Q1 at 6.79%.
1 https://www.attomdata.com/news/most-recent/q1-2024-loan-origination-report/
Critical Defect Rate by Quarter: Q2 2023 — Q1 2024
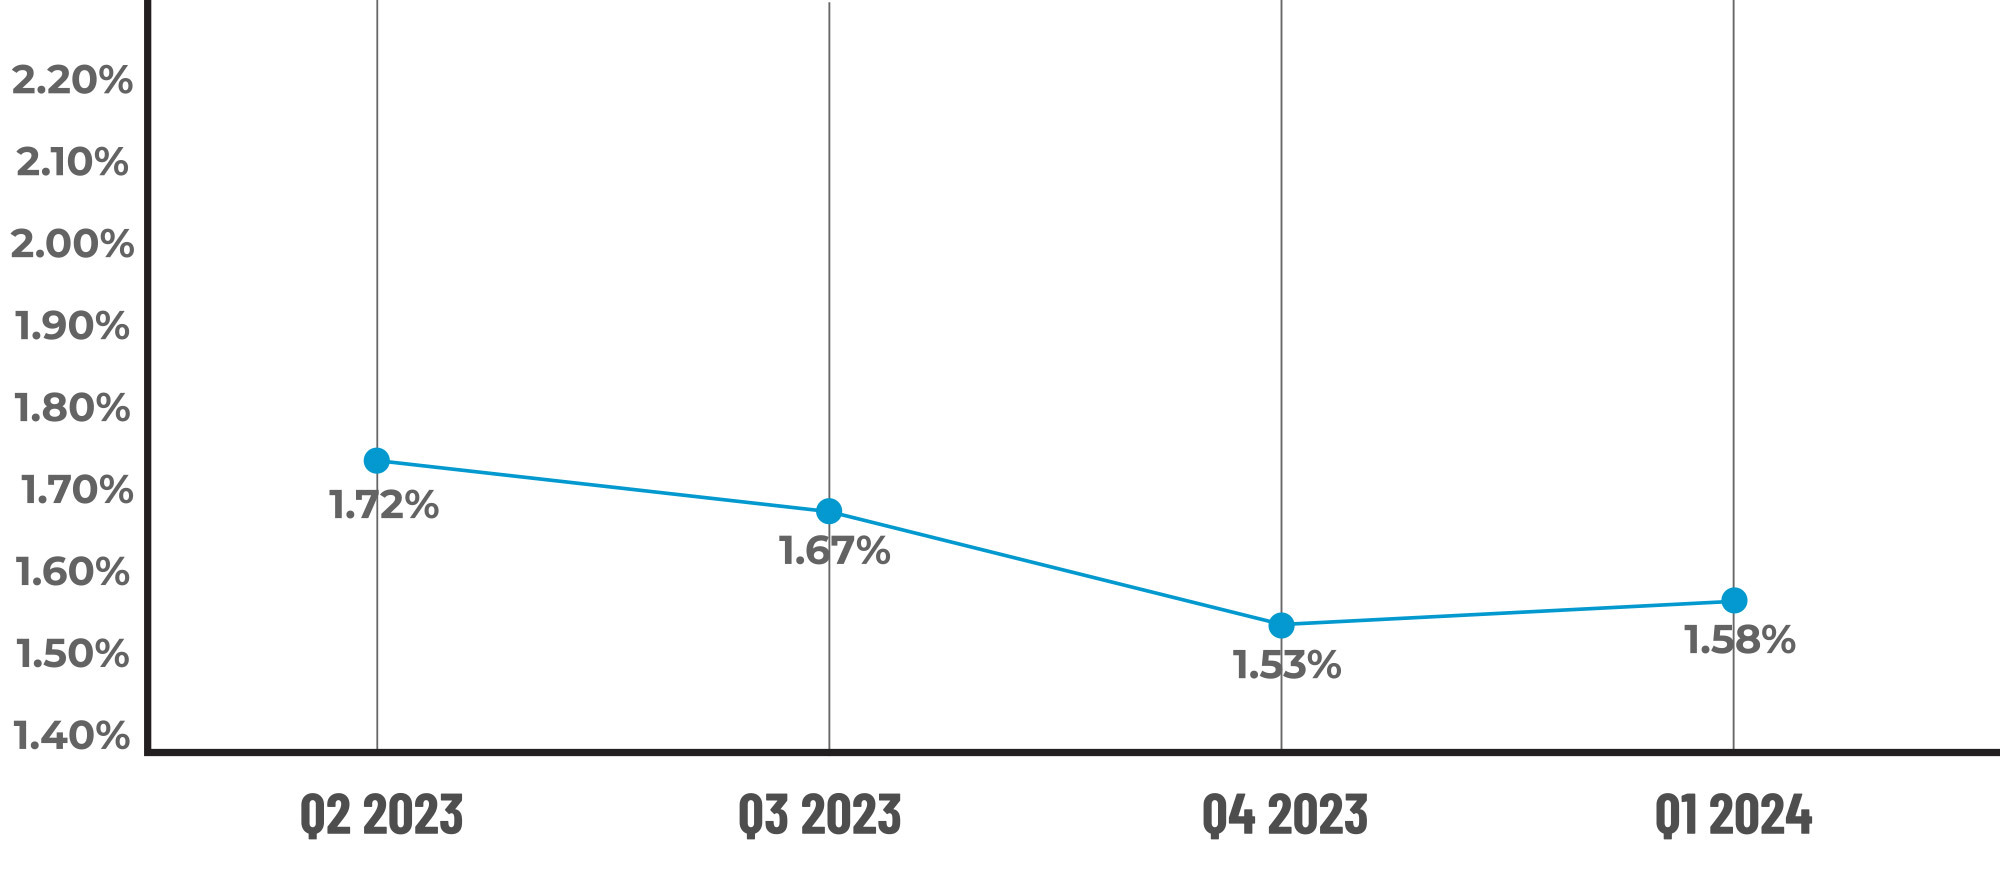
Figure 1 displays the percentage of loans with critical defects by quarter for Q2 2023 through Q1 2024.
QC Trends by Defect Category
Although Income/Employment maintained its position as the leading category of defects, performance improved tremendously, with the defect rate dropping by 36.43% from Q4 2023 to close Q1 2024 at 23.42%. Borrower and Mortgage Eligibility and Assets rounded out the top three defect categories last quarter, but those were supplanted in Q1 by Legal/Regulatory/Compliance, which increased 208.37% quarter-over-quarter to 16.22%, and Loan Documentation, which rose 36.85% to 14.41%.
Loan Documentation is always a volatile defect category, and these errors usually reflect sloppiness more than anything. Thus, the increase in this category is disappointing but not super concerning. Conversely, the dramatic rise in Legal/Regulatory/Compliance defects raises eyebrows. Typically, one would expect a nearly 3x increase in this category to be triggered by a major rule/requirement change, but that wasn’t the case in Q1. Instead, this increase may be more reflective of a flurry of more minor changes.
The ACES Compliance NewsHub Compliance Calendar tracked 15 changes that went into effect in Q1 and another 18 from the prior quarter, issued by a range of state and federal entities. One misinterpretation or failure to make the necessary process changes could have a compounding effect on defects, especially in a low-volume environment where every mistake is much more apparent and costly.
While the decrease in Income/Employment defects was a welcome sight, especially after the nearly 60% increase between Q3 and Q4 last year, the improvements here were offset by increases in five of the nine categories this report consistently tracks. Furthermore, the Credit category experienced the second-highest quarter-over-quarter increase in defects, rising 99.78% from Q4. Even with the increase, Credit only ranks fifth out of the nine commonly tracked defect categories, so in terms of the whole picture, there are larger areas of concern, relatively speaking.
However, the sub-category data showed a shift in which eligibility is now the most significant contributor to the defects in this category. Credit Eligibility issues relating to credit history and credit score are mostly uncurable issues for the lender and increase repurchase risk overall. This area bears attention going forward to see if the mix is a trend and not just a one-quarter blip on the radar.
The remaining areas that comprise the “Big 4” underwriting categories – Assets and Liabilities – saw mixed results. Asset defects decreased by 32.27% to comprise just 11.71% of all defects, fueled by improvements in the Calculation/Analysis sub-category. Meanwhile, Liabilities increased by 6.5% to 7.21%, which still ranks in the bottom quartile of defect categories but should be an area lenders examine closely in coming quarters. As noted earlier in this report, Insurance defects have generally been excluded from this report, given the negligible number of defects observed in this category from quarter to quarter. That was not the case in Q1, which saw defects reach 8.11%. To put this into perspective, Insurance defects accounted for less than 1% of all defects in both 2022 and 2023. The Insurance defect category encompasses all levels of insurance on a loan, including hazard insurance, flood insurance and, if applicable, mortgage insurance. Insurance in general, but hazard insurance and rising premiums in particular, is a very hot topic in the industry. Thus, this category’s rapid rise in defect percentage warrants increased attention moving forward.
It is difficult to determine a singular root cause for the increase in Insurance defects this quarter, but given current levels of scrutiny, one thing is for certain – investors are watching this area. Thus, defects like proper determination of flood zone, correct insured amount (replacement cost of dwelling), and the complexities of documenting insurance aspects of a condo are areas that lenders should shore up in their QC process.
Critical Defects by Fannie Mae Category: Q1 2024
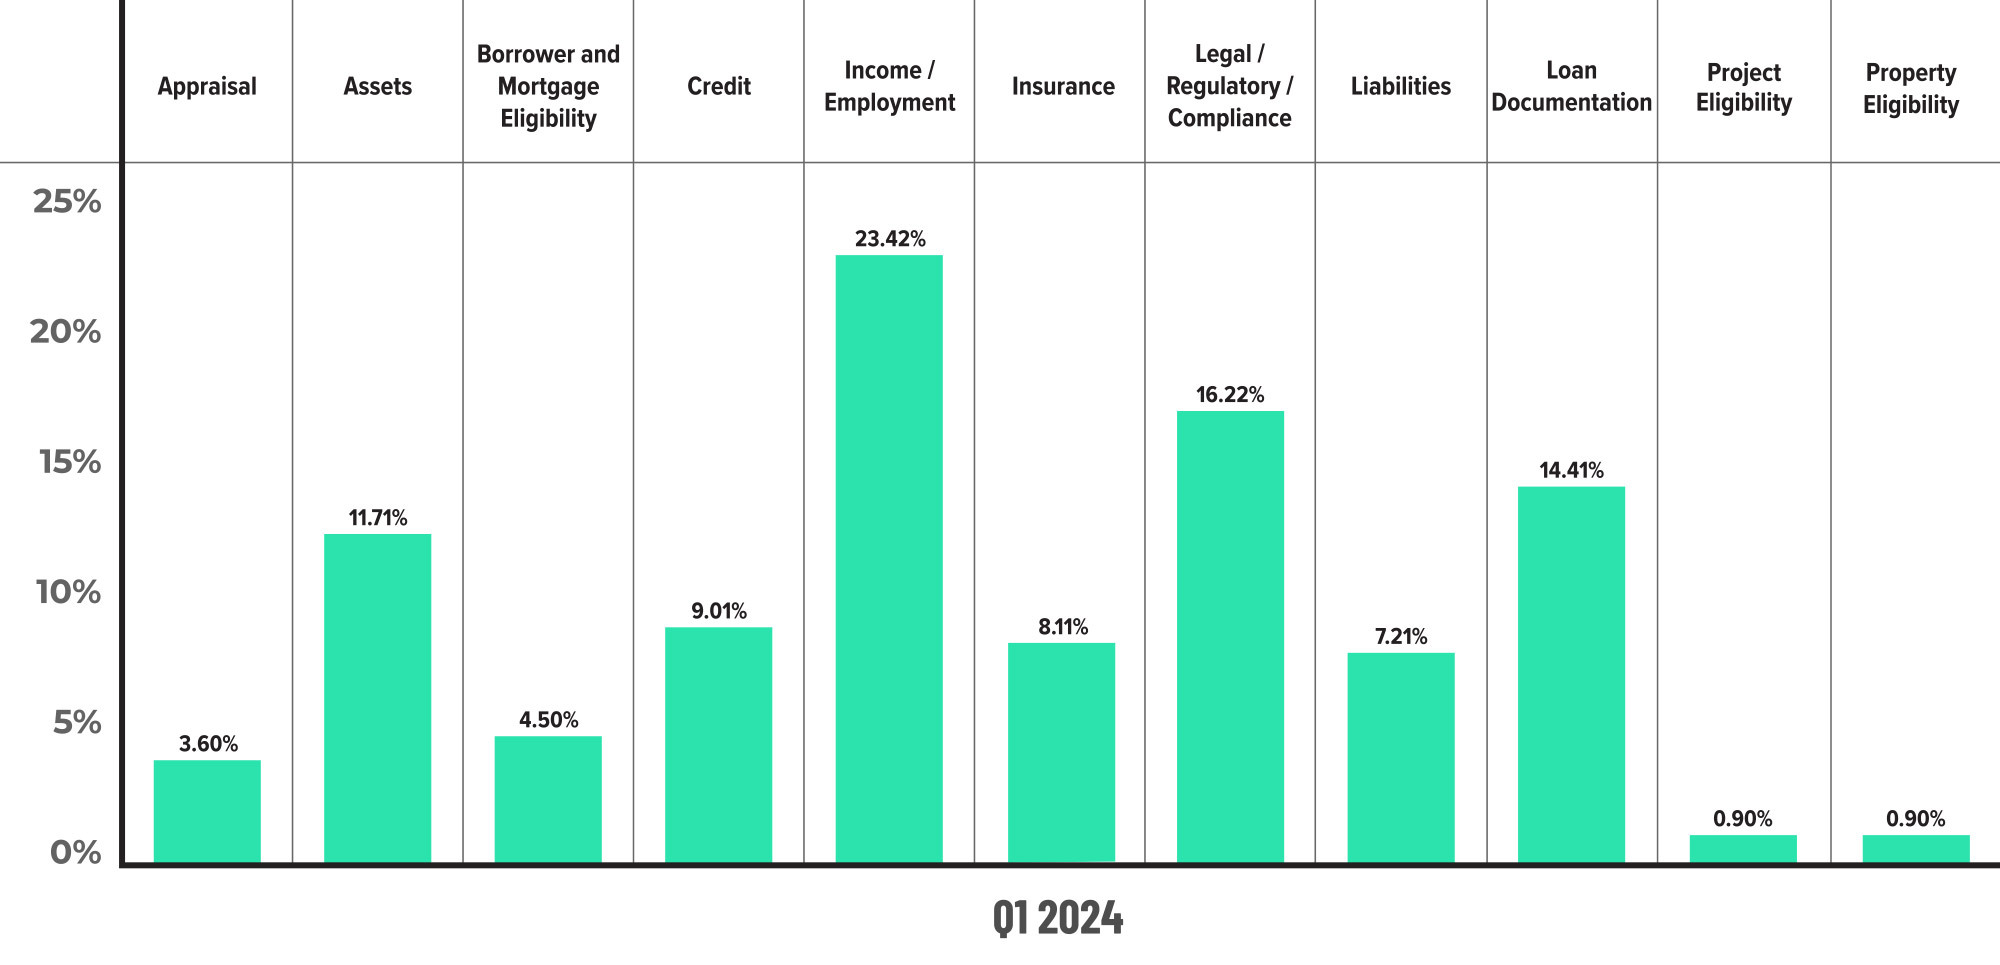
Figure 2 displays the dispersion of critical defects across Fannie Mae categories for Q1 2024. Please note that totals shown may not add up to 100%, as categories with negligible defects have been omitted.
Critical Defects by Fannie Mae Category: Q4 2023 vs. Q1 2023
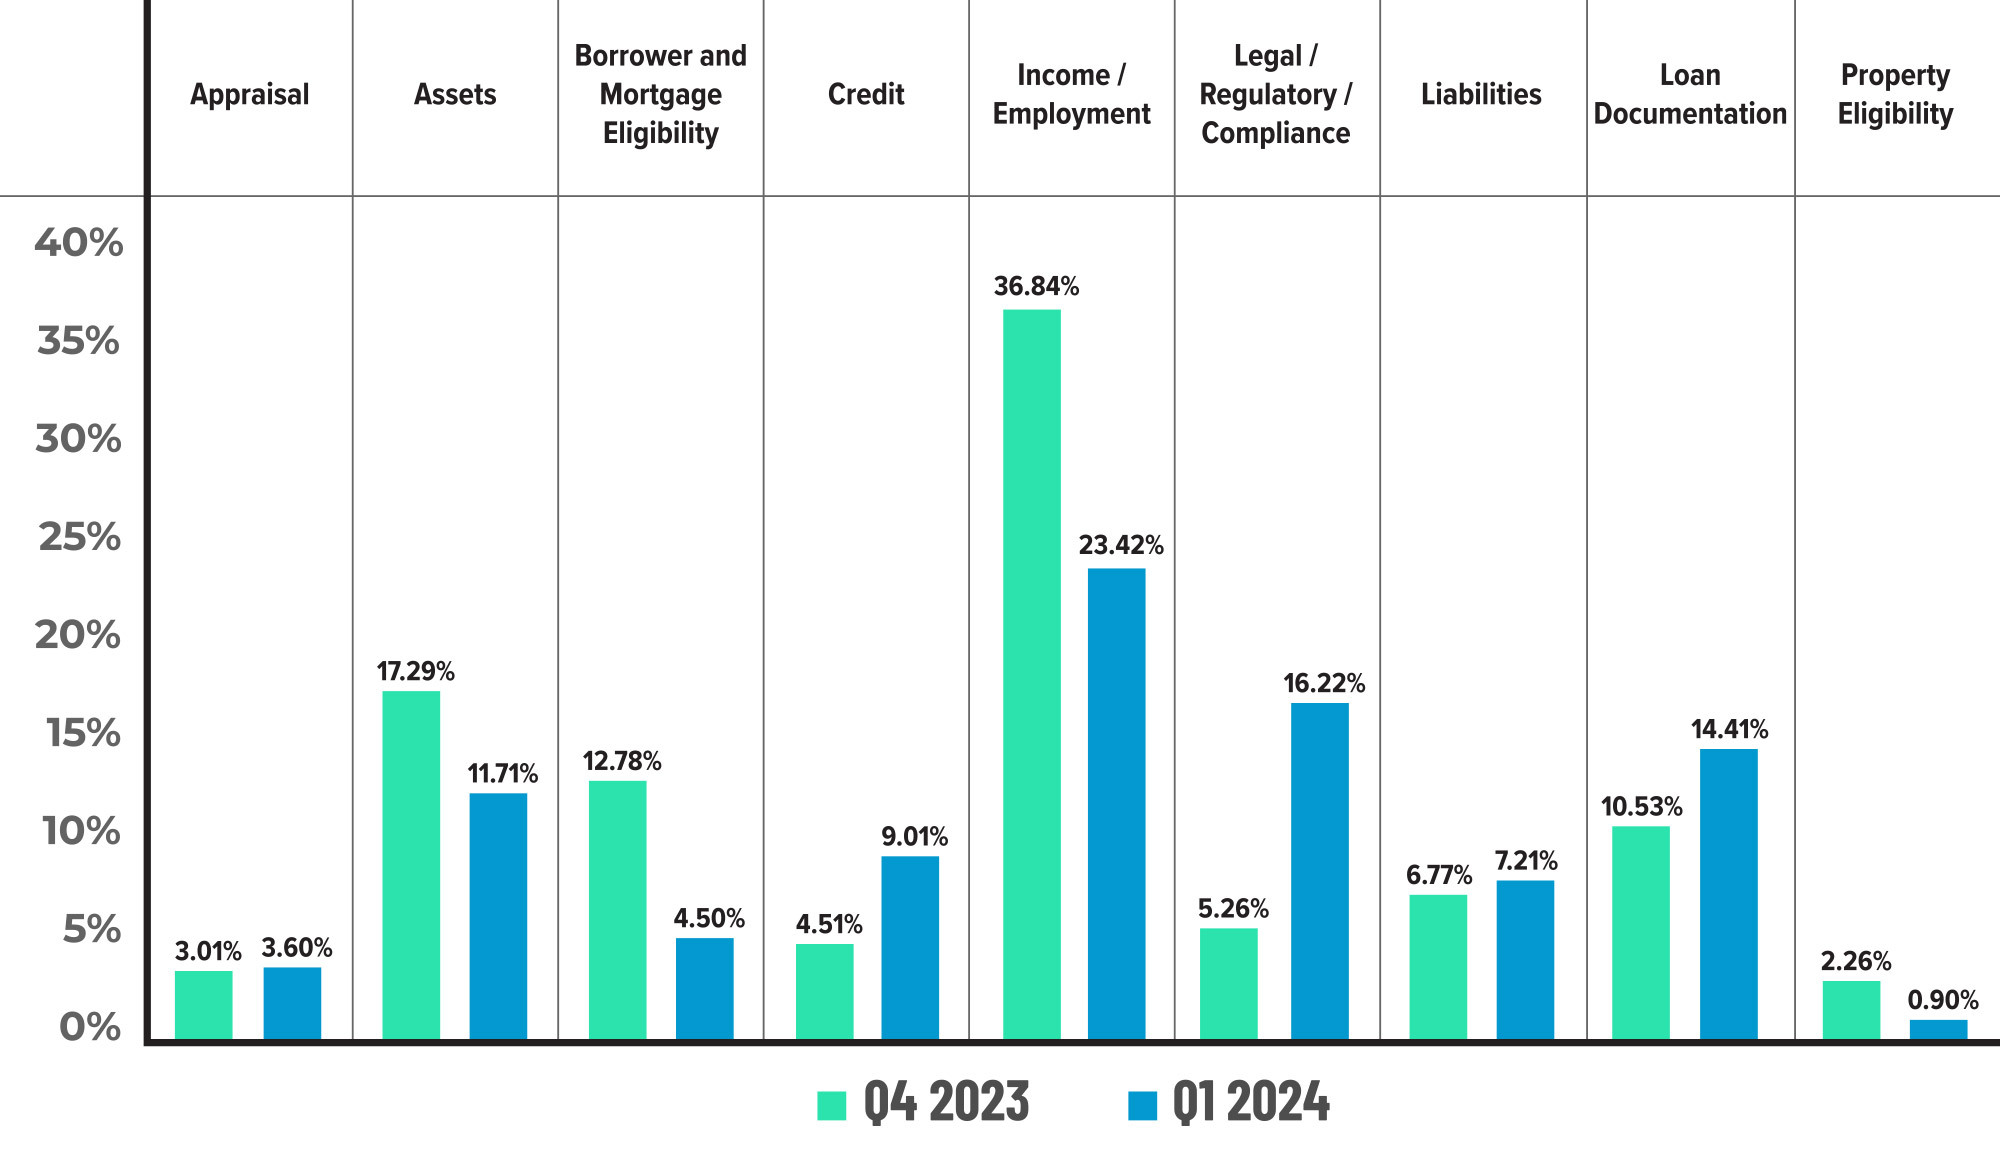
Figure 3 displays the critical defect rate by Fannie Mae category, comparing Q4 2023 to Q1 2024.
Critical Defects by Fannie Mae Underwriting Sub-category: Q1 2024
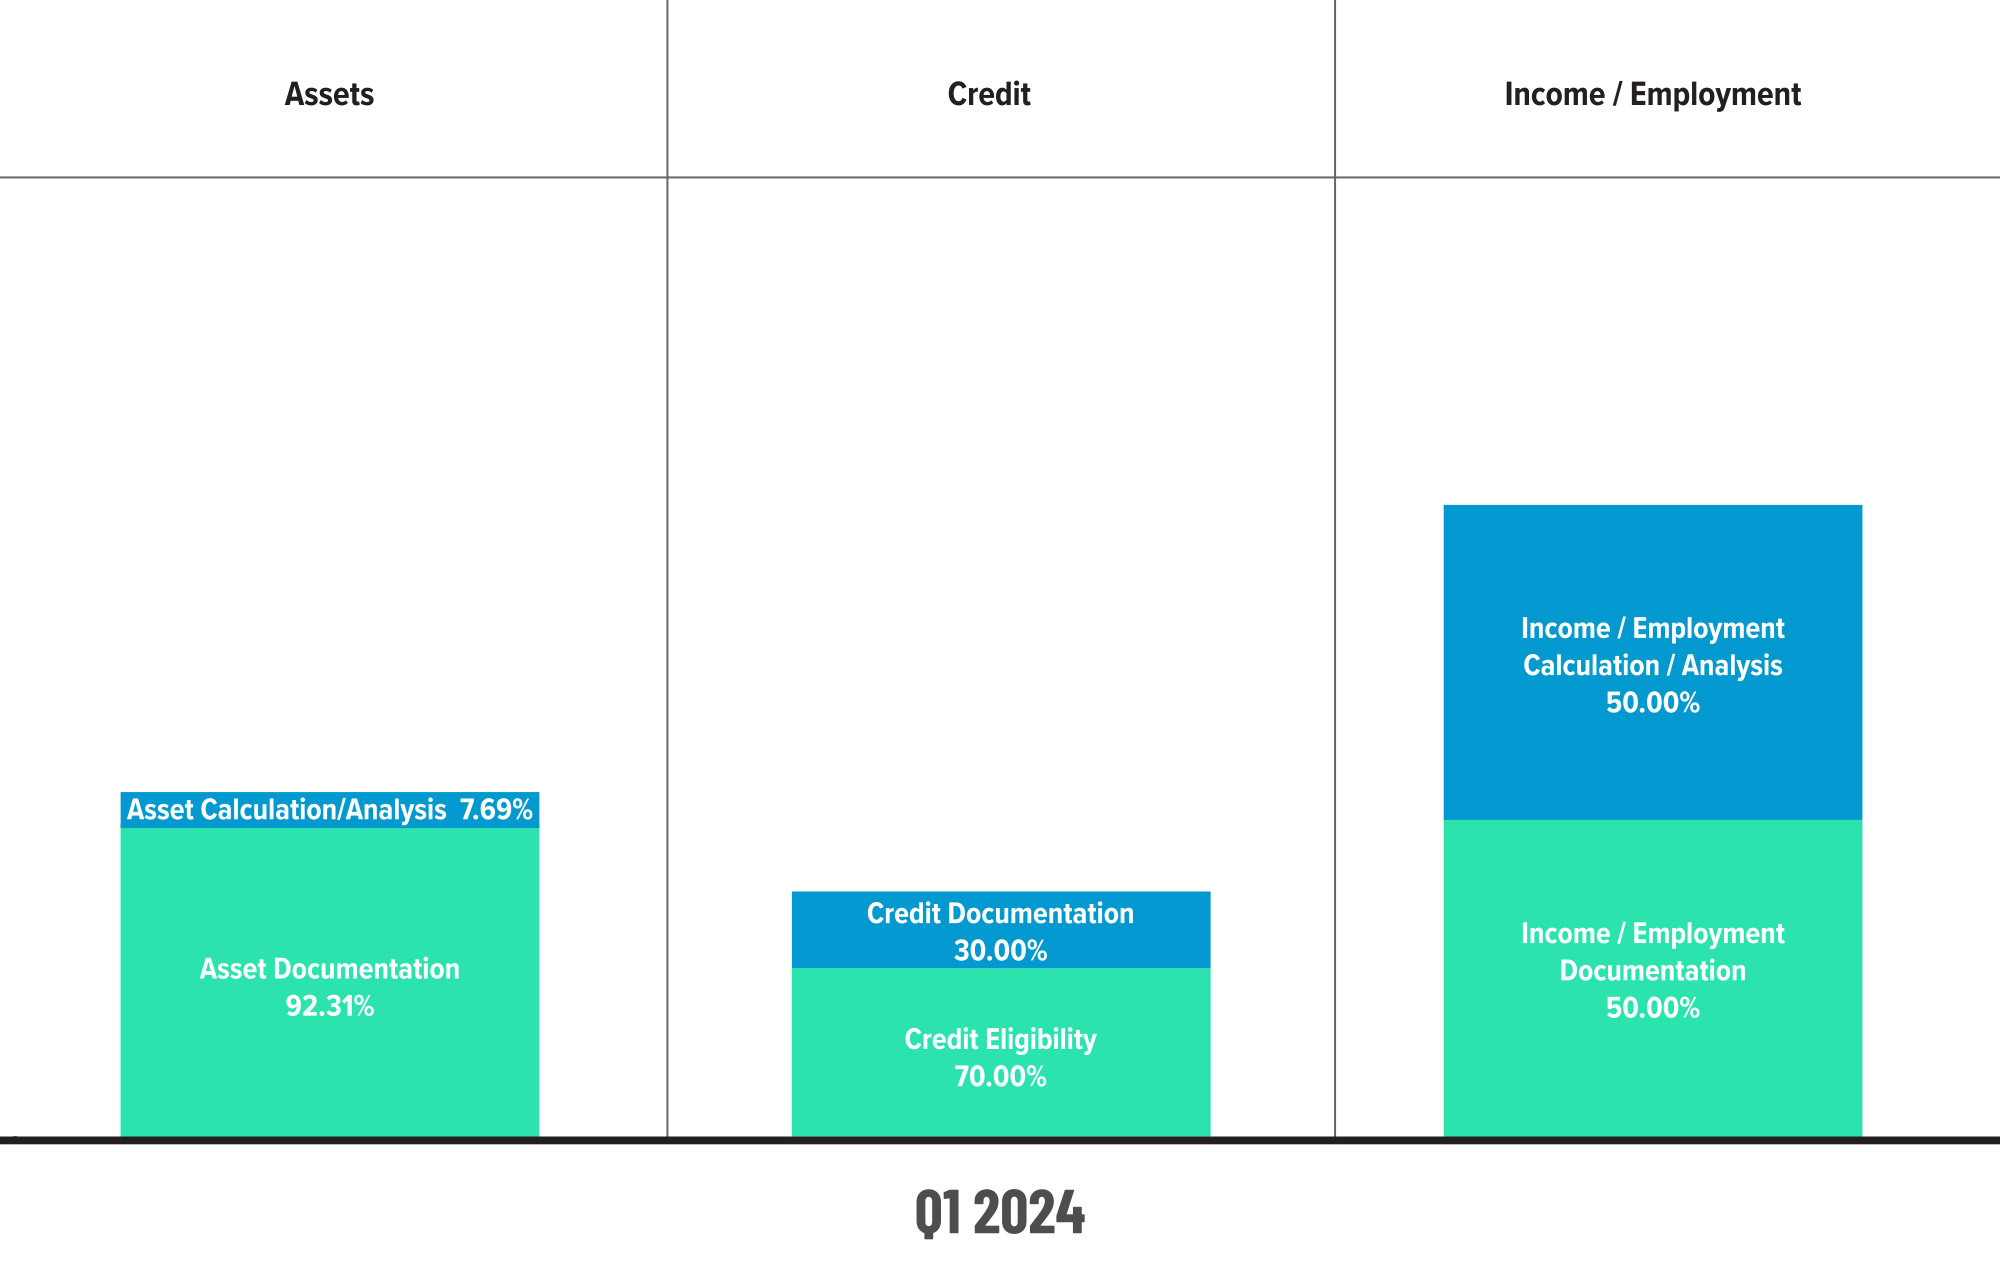
Figure 4 displays sub-category information for Q1 2024 within the Assets, Credit and Income/Employment categories.
Critical Defects by Fannie Mae Underwriting Sub-category: Q4 2023 vs. Q1 2024
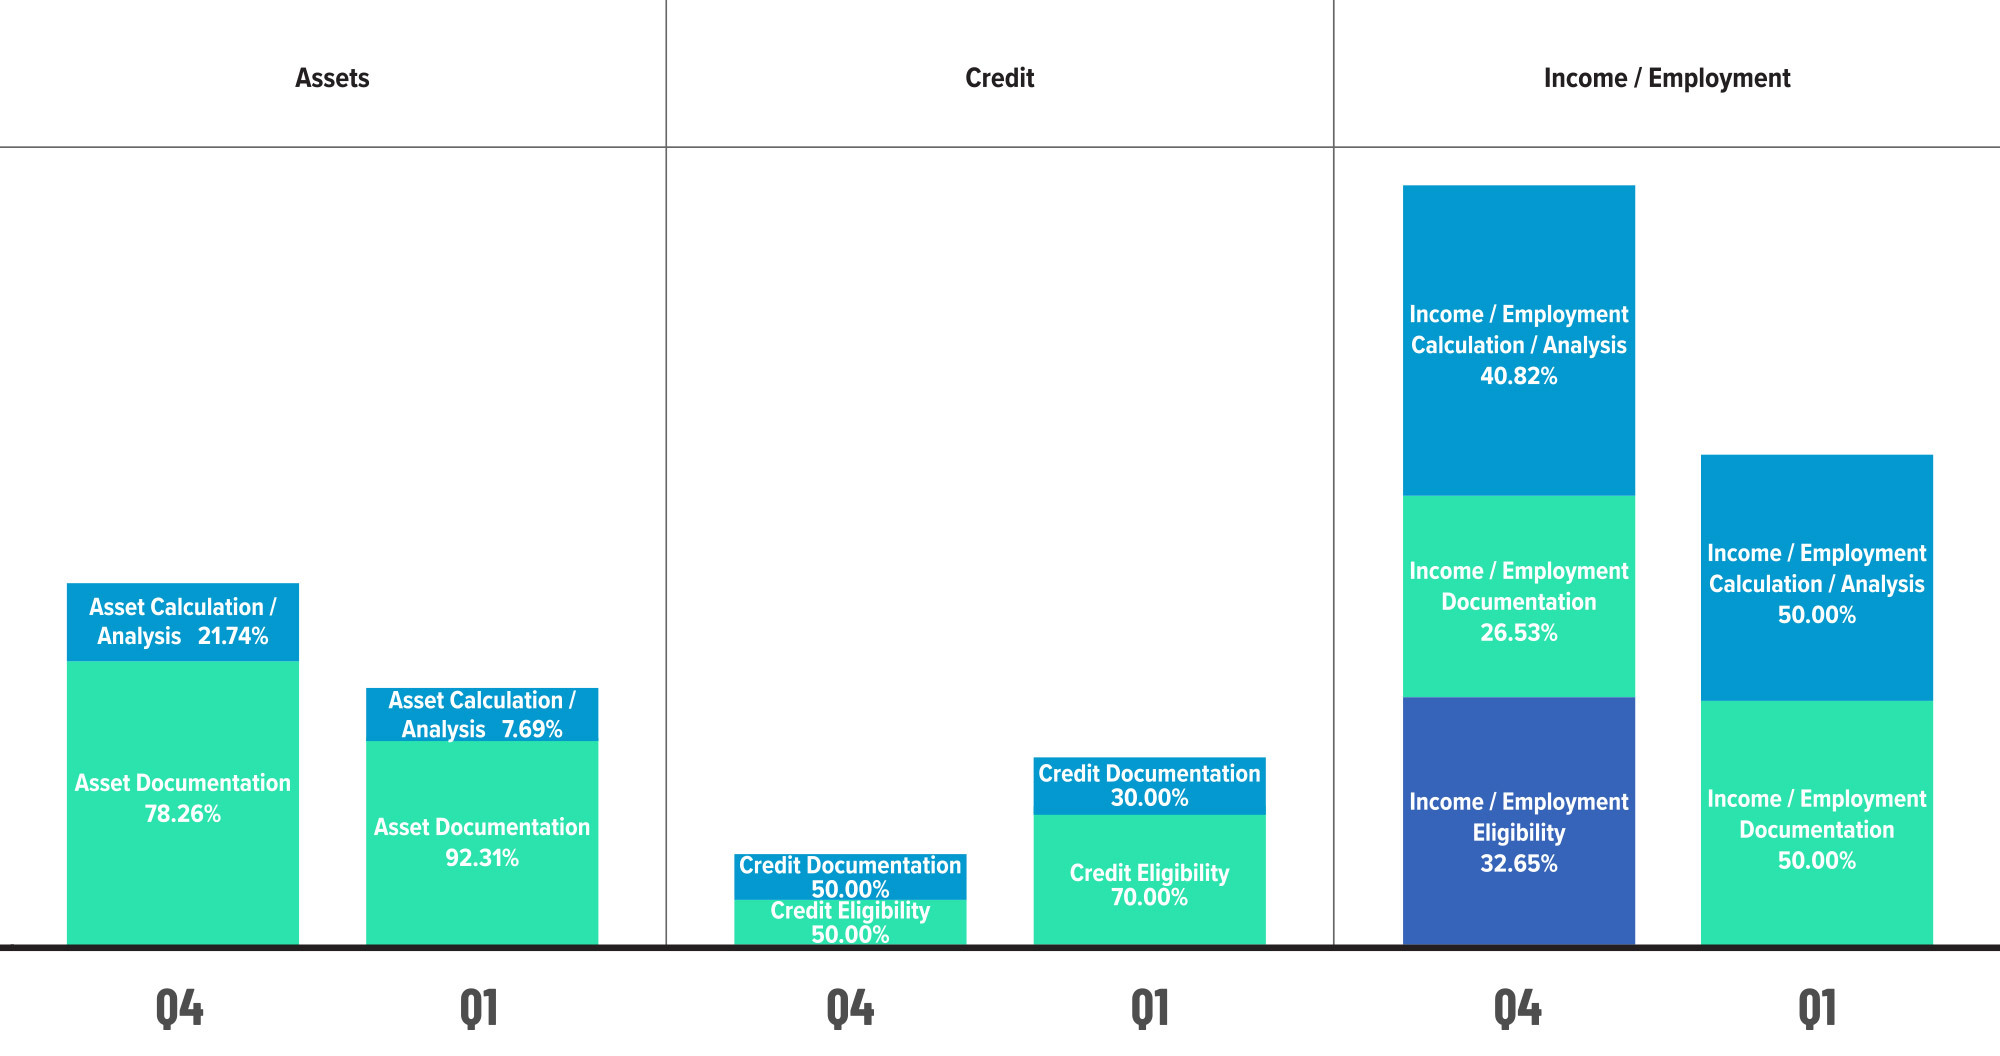
Figure 5 displays sub-category information within the Assets, Credit and Income/Employment categories, comparing Q4 2023 to Q1 2024.
QC Trends by Loan Purpose
Lenders shifted their review focus in Q1, opting to increase purchase reviews by 2.23% while reducing refinance reviews by 13.3%. Given the increase in purchase defects despite the decline in review share in Q4, this shift makes sense but ultimately may not have been the wisest course of action, as refinance defect share increased 100.11% and purchase defect share decreased 10.42%. Without a more meaningful drop in interest rates, any refinance transactions in the current market bear extra scrutiny, and lenders need to find the balance between purchase and refinance reviews to ensure they are monitoring their risk in each of these areas appropriately.
Defects by Loan Purpose: Q1 2024
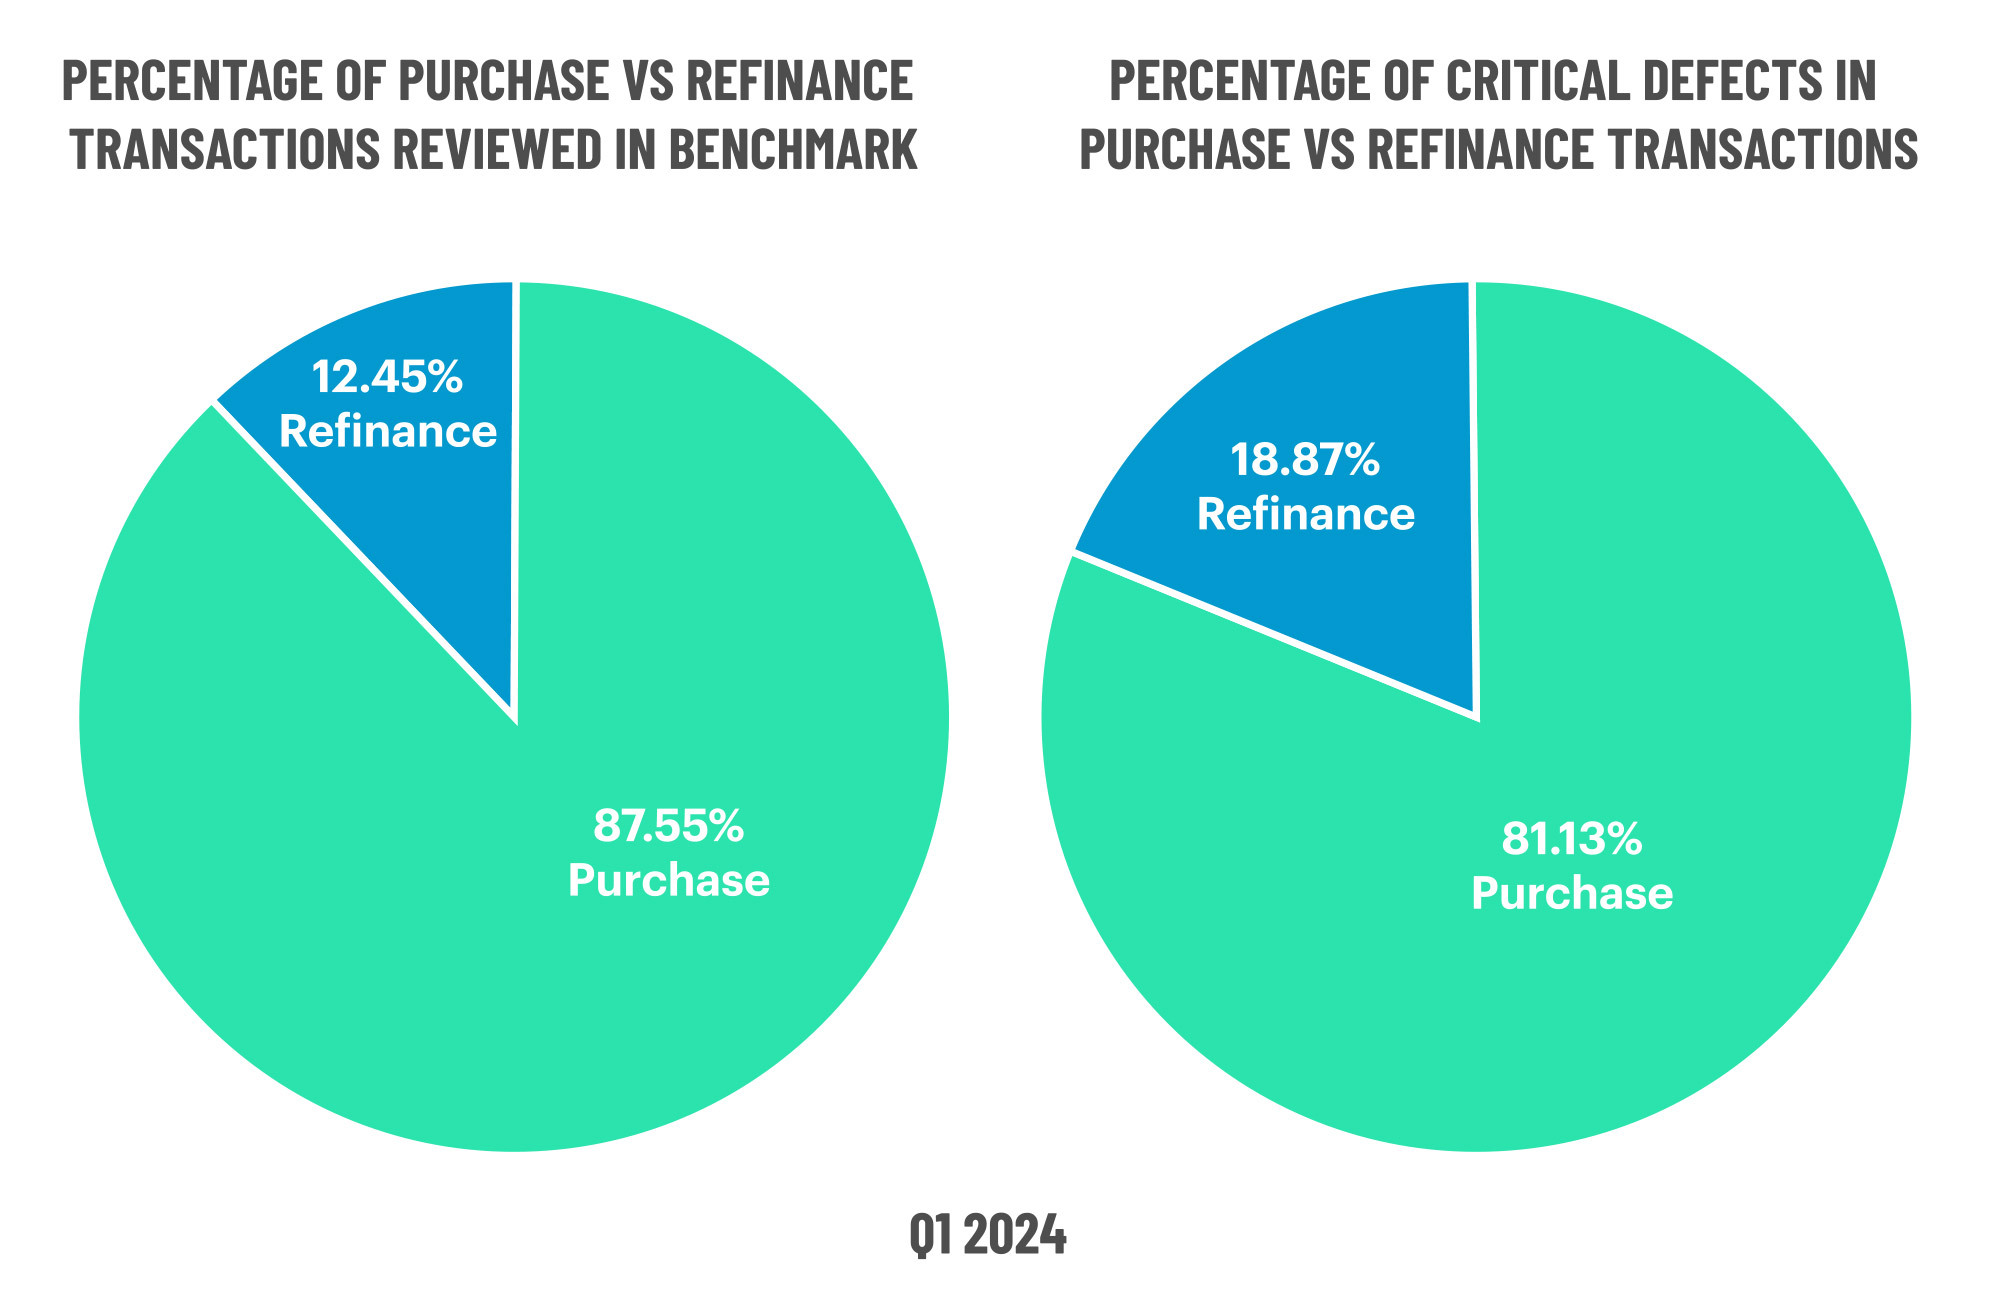
Figure 6 displays the loans reviewed and critical defects by loan purpose for Q1 2024.
QC Trends by Loan Product Type
Lenders increased review share for conventional and VA loans in Q1 by 3.66% and 19.85%, respectively. Despite the review share increase, VA loan performance improved considerably quarter-over-quarter, as defects declined 37.48%. Unfortunately, the same did not apply to conventional loans, which experienced a 24% increase in defects from Q4. The rise in refinance defects most certainly fueled this increase, as most (if not all) refinance transactions executed in the current rate environment are likely to fall in the conventional category.
Conversely, lenders decreased their reviews of FHA and USDA loans and were rewarded, as FHA defect share declined by 19.56% while USDA defect share remained unchanged from Q4.
Defects by Loan Product Type: Q1 2024
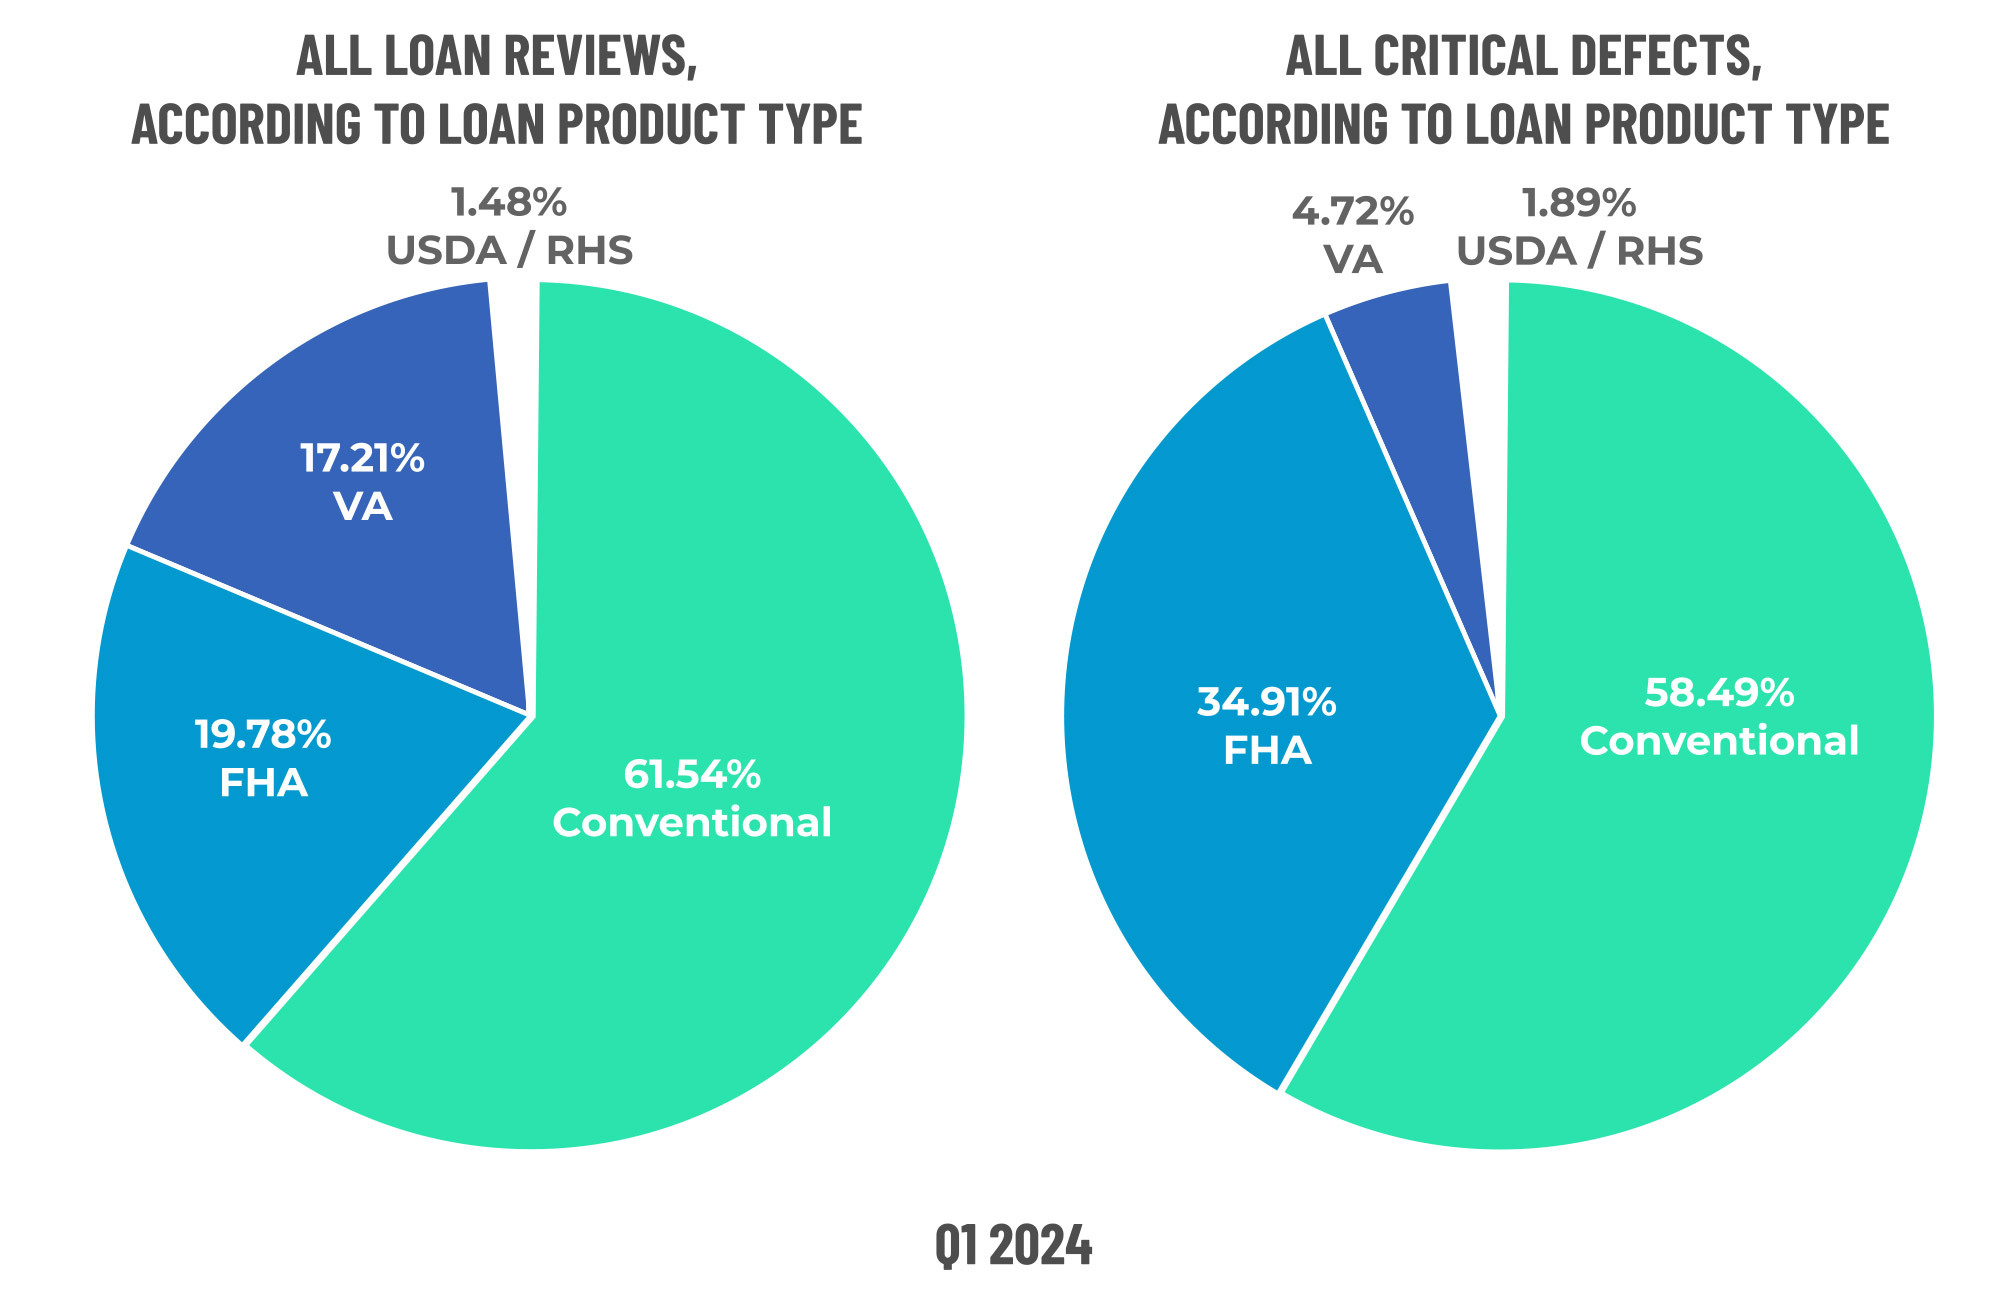
Figure 7 displays the loans reviewed and critical defects by loan type for Q1 2024.
Economic Discussion
One area that bears examination and discussion is the GSEs’ changes to their eligibility standards for condominiums and cooperatives, which went into effect in September 2023. The update now requires a thorough evaluation of a property’s condition before approving a mortgage. This evaluation includes examining the ownership structure, financial reserves, legal issues and insurance coverage. The revised eligibility criteria from the agencies also clarify the distinction between essential and routine repairs, as well as the importance of special assessments and inspections in addressing maintenance issues.
These changes are in direct response to the Surfside condominium disaster and have long-tail implications for sellers in addition to lenders. On the owner side, many are facing dramatic increases from homeowners associations (HOAs) to cover deferred maintenance and ensure their structures are up to code. For those that cannot cover a 3-4x increase in dues, selling is the obvious solution, but the appetite for condos, especially beach-front properties or those near water, may not be as voracious as it once was. Furthermore, sellers will need to disclose those increased dues and all of the maintenance and improvements those dues are intended to cover, which could also discourage potential buyers.
For lenders, these updated requirements not only further complicate what was already a more complex process but also raise the stakes for condo lending in general, especially in areas like Florida with an increased risk of water-related issues and natural disasters. In the current lending environment, buybacks of any kind are an exceptionally tough pill to swallow. Under the new rules, lenders too heavily concentrated in the wrong building could find themselves out of business. Thus, lenders must understand the nuances of the GSEs’ condo requirements and adjust their internal processes appropriately to ensure property eligibility before approval and funding.
Conclusion
It is evident the current mortgage market presents unique challenges that lenders must navigate with precision. While the overall critical defect rate remains low by historical standards, the uptick observed in a quarter with record-low origination volumes raises concerns. The substantial increases in categories such as Credit and Legal/Regulatory/Compliance and an unexpected rise in Insurance defects signal areas that demand heightened attention moving forward.
The rise in refinance defects, particularly within the conventional loan category, underscores the need for balanced review processes across purchase and refinance transactions. Additionally, the sharp increase in Legal/Regulatory/Compliance defects suggests that even small regulatory changes can have compounding effects, especially in a low-volume environment.
In summary, while there are positive developments in specific underwriting categories, the data clearly shows that lenders face mounting pressure to maintain quality amid fluctuating market dynamics. As the industry adapts to evolving standards and external factors, a proactive approach to quality control will be essential to mitigating risk and ensuring long-term stability.
About the ACES Mortgage QC Industry Trends Report
The ACES Mortgage QC Industry Trends Report represents a nationwide post-closing quality control analysis using data and findings derived from mortgage lenders utilizing the ACES Analytics benchmarking software.
This report provides an in-depth analysis of residential mortgage critical defects as reported during post-closing quality control audits. Data presented comprises net critical defects and is categorized in accordance with the Fannie Mae loan defect taxonomy.
About ACES
ACES Quality Management is the leading provider of enterprise quality management and control software for the financial services industry. The nation’s most prominent lenders, servicers and financial institutions rely on ACES Quality Management & Control® Software to improve audit throughput and quality while controlling costs, including:
- 70% of the top 20 independent mortgage lenders;
- 7 of the top 10 loan servicers;
- 11 of the top 30 banks; and
- 3 of the top 5 credit unions in the United States.
Unlike other quality control platforms, only ACES delivers Flexible Audit Technology, which gives independent mortgage lenders and financial institutions the ability to easily manage and customize ACES to meet their business needs without having to rely on IT or other outside resources. Using a customer-centric approach, ACES clients get responsive support and access to our experts to maximize their investment.
For more information, visit www.acesquality.com or call 1-800-858-1598.
Media Contact: Lindsey Neal | DepthPR for ACES | (404) 549-9282 | lindsey@depthpr.com
View all reports