ARMCO’s Mortgage QC Industry Trends Report represents an analysis of nationwide quality control findings based on data derived from the ACES Analytics benchmarking software.
Executive Summary
QC Industry Trends – Overview
QC Industry Trends – by Category
QC Industry Trends – by Loan Purpose
QC Industry Trends – by Loan Type
Conclusion
About this Report
Executive Summary
This report utilizes information derived from loan files analyzed by the ACES Analytics benchmarking system. It provides defect-related mortgage quality control data for Q2 2017.
Findings for the Q2 2017 Trends Report are based on post-closing quality control data from over 90,000 closed loans identifying more than 125,000 defects. All reviews and defect data evaluated in this report are based on loan audits selected by lenders for full file reviews.
Defects are categorized using the Fannie Mae loan defect taxonomy. Data for any given calendar quarter are analyzed approximately 90 days after the end of the quarter to allow for sufficient elapsed time for the post-closing quality control cycle to be completed. Hence, ARMCO publishes the analysis for Q2 2017 in early Q1 2018.
Summary of Findings
The leading critical defect categories for Q2 2017 were Borrower and Mortgage Eligibility, Credit, and Income/Employment. Purchase transactions continued to dominate the percentage of loan originations, and defects associated with underwriting and eligibility made up the majority of critical defects.
Report highlights include:
- The critical defect rate continued its upward trend, reaching 1.76% in Q2 2017, an increase of 9% over the Q1 2017 critical defect rate of 1.61%.
- The top critical defect category for Q2 2017 was Borrower and Mortgage Eligibility.
- Purchase loans account for a disproportionately high number of critical defects.
QC Industry Trends – Overview
The critical defect rate increased for a third consecutive quarter reaching 1.76% in Q2 2017. This represents a 9% increase over the previous quarter and a 39% increase over the 2016 low of 1.27% in Q3.
NOTE: A critical defect is defined as a defect that would result in the loan being uninsurable or ineligible for sale. The critical defect rate reflects the percentage of loans reviewed for which at least one critical defect was identified during the post-closing quality control review.
Figure 1 displays critical defect rates—the percentage of total closed loans with critical defects—for the past four calendar quarters.
Critical Defect Rate: Q3 2016 – Q2 2017
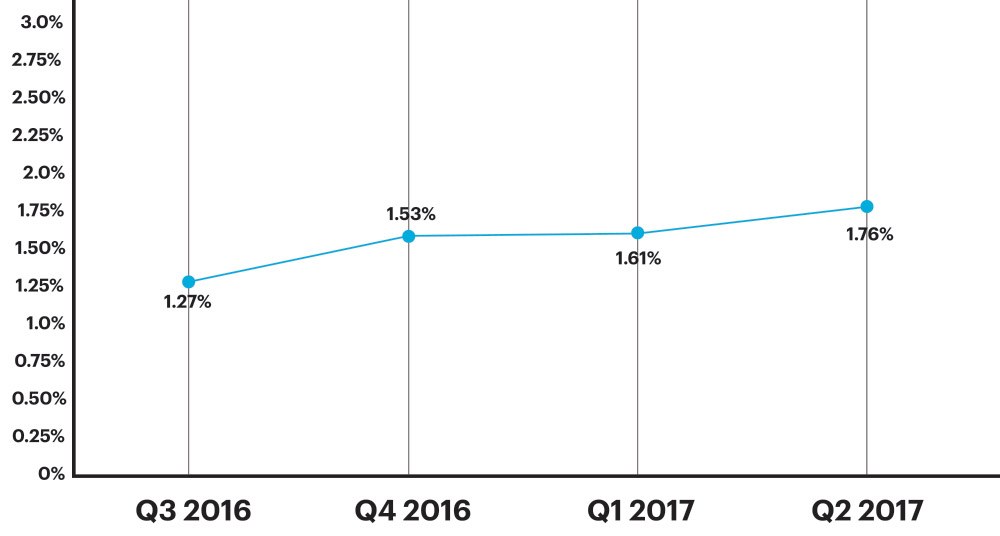
Figure 1: Percentage of loans with critical defects by quarter, Q3 2016 through Q2 2017
QC Industry Trends by Category
As in Q1, Borrower and Mortgage Eligibility ranked as the top critical defect category in Q2 2017, accounting for 26.04% of all reported critical defects. This category was followed by Credit, which accounted for 23.96% of all reported critical defects, and Employment and Income, which accounted for 15.63% of all reported critical defects.
Figure 2 shows all reported net critical defects, broken down by Fannie Mae defect category.
Critical Defects by Fannie Mae Category, Q2 2017
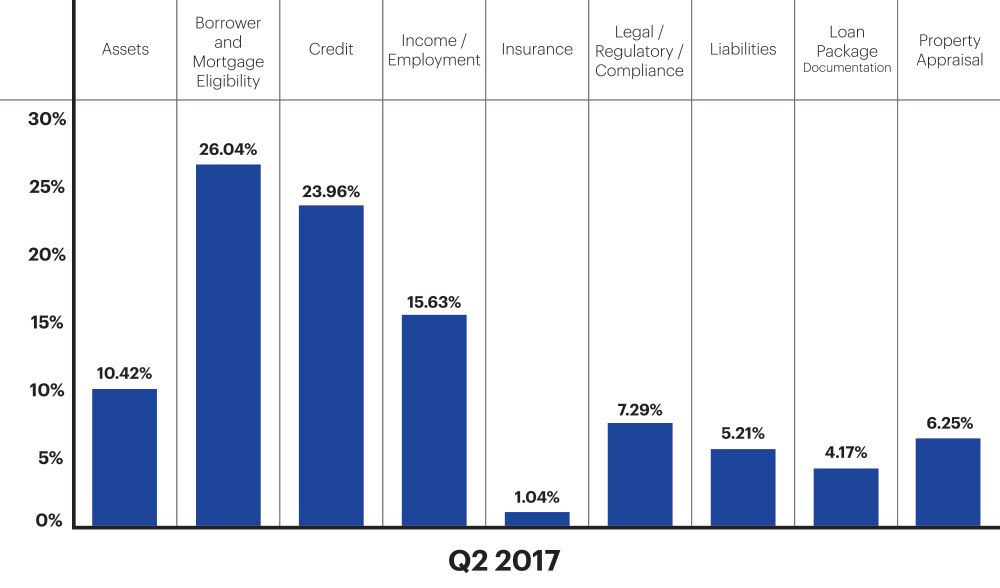
Figure 2: Q2 2017 net critical defects according to Fannie Mae defect category
Borrower and Mortgage Eligibility-related defects rose slightly over the previous quarter, from 23.76% in Q1 2017 to 26.04% in Q2 2017. More than 68% of these defects were attributed to Mortgage/Program Eligibility issues. Mortgage/Program Eligibility defects are typically associated with failure to meet specific product underwriting guidelines and requirements. This likely results from lenders’ broadening of loan offerings in an effort to achieve market share and growth in a tight purchase-driven market. Typically, as product offerings expand, lender personnel’s lack of understanding increases risk and creates a growing disparity between required training and current knowledge.
Credit defects ranked as the second highest defect category in Q2 2017, accounting for 23.96% of all critical defects. This represents an increase of over 25% over Q1, where Credit defects comprised 17.82% of all critical defects. Nearly two-thirds – 65% – of critical defects in the Credit category were associated with sub-standard documentation of credit issues and inconsistency or discrepancies in credit information.
Employment and Income defects ranked as the third highest critical defect category in Q2 at 15.63% — a notable drop from Q1. Within this category, almost 40% of all defects were associated with income eligibility, followed closely by income documentation. Inaccuracy and/or discrepancies identified as a part of the reverification process was the top employment and income defect identified in Q2.
As overall defects associated with employment and income dropped in Q2, there was a notable shift of the type of defects identified. In Q1, the majority of employment and income defects were due to missing or insufficient documentation, while Q2 saw a shift to income and employment eligibility. We will follow this through Q3 to identify any trends that may be developing.
Figure 3 shows each of the top three Fannie Mae critical defect categories broken down by sub-category.
Top Three Critical Defect Categories by Sub-category, Q2 2017
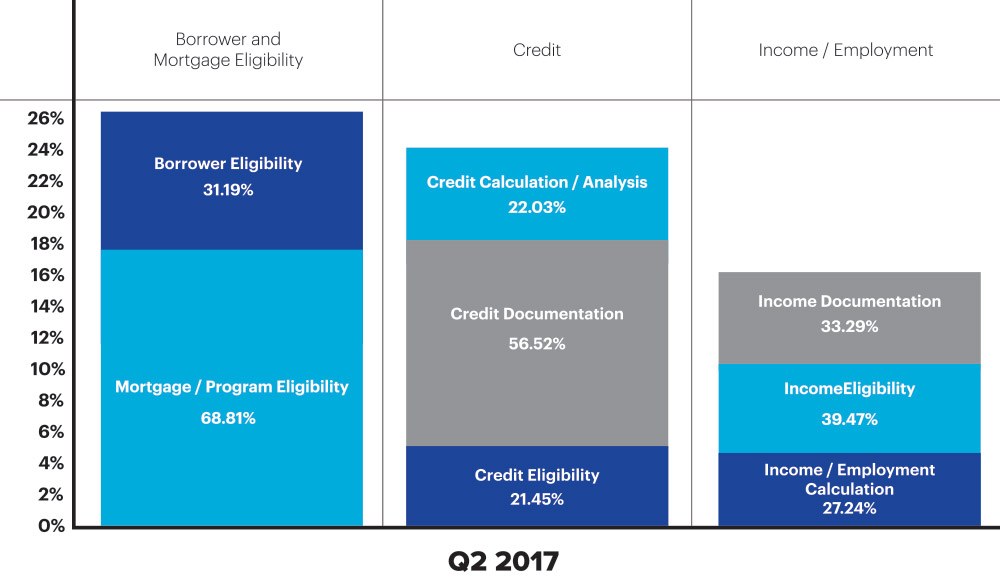
Figure 3: Q2 2017 top three critical defect categories broken down by sub-category
Perhaps the most interesting critical defect trend in Q2 2017 was in the Legal/Regulatory/Compliance category, which decreased over 50% from Q1 2017 to Q2 2017, the second consecutive quarter-over- quarter significant decrease.
Figure 4 illustrates trends in the Legal/ Regulatory/Compliance defects category for the past four quarters. Earlier in 2016 Legal/Regulatory/Compliance defects were heavily driven by implementation of the TILA / RESPA Integrated Disclosure (TRID) Rule in October 2015 by the Consumer Financial Protection Bureau (CFPB).
Through the early months of 2016, lenders were battling investors on eligibility issues pertaining to the sale of loans that contained TRID related defects. In Q3 of 2016, almost one year after the implementation of TRID, Legal/Regulatory/Compliance defects was still the top critical defect category. However, over the course of 2016 and into 2017, several trends converged to drive Legal/Regulatory/ Compliance defects much lower as a percentage of overall critical defects:
First, investors and lenders made necessary changes to improve their processes to greatly reduce defects associated with TRID.
Second, lenders reclassified many TRID defects previously considered “high” or “critical into “moderate” or “lower” categories. This reclassification came about as lenders gained clarity over time regarding the criticality of various TRID issues and their impact on loan saleability.
View previous QC Trends Reports
Finally, 2017 brought a reduction in overall loan production compared to 2016 and a much heavier weighting toward purchase transactions.
Legal/Regulatory/Compliance as a Percentage of the Total Critical Defects, Q3 2016 – Q2 2017
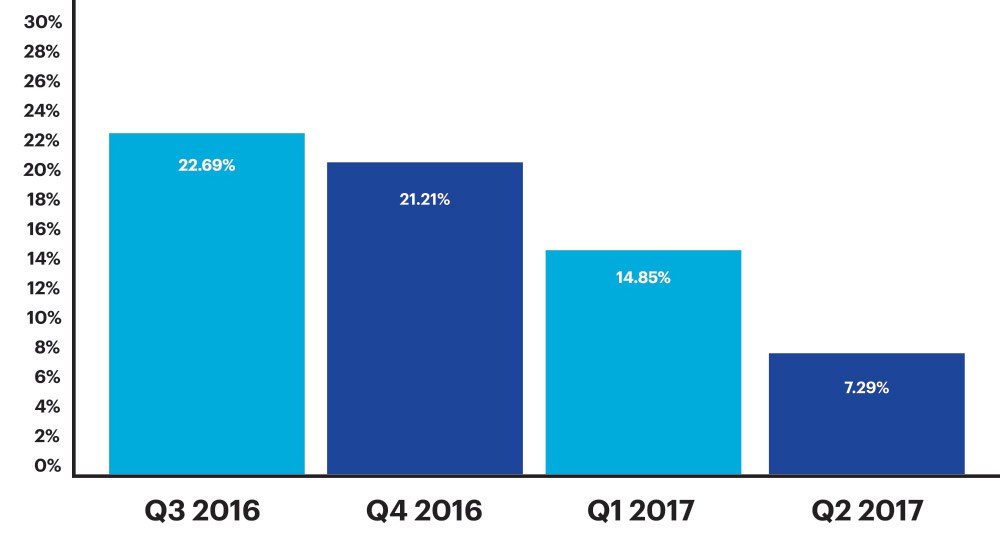
Figure 4: Q3 2016-Q2 2017 trending Legal/Regulatory/Compliance critical defects
QC Industry Trends – By Loan Purpose
In Q2 2017, purchase transactions accounted for just under 75% of all reviewed loans, but over 80% of all reported critical defects. The distribution of critical defects among purchase and refinance transactions, with more critical defects attributed to purchases, aligns with the added complexity associated with purchase transactions.
Figure 5 provides a comparison between all reviewed loans by loan purpose and all critical defects by loan purpose.
Percentage of Critical Defects According to Loan Purpose, Q2 2017
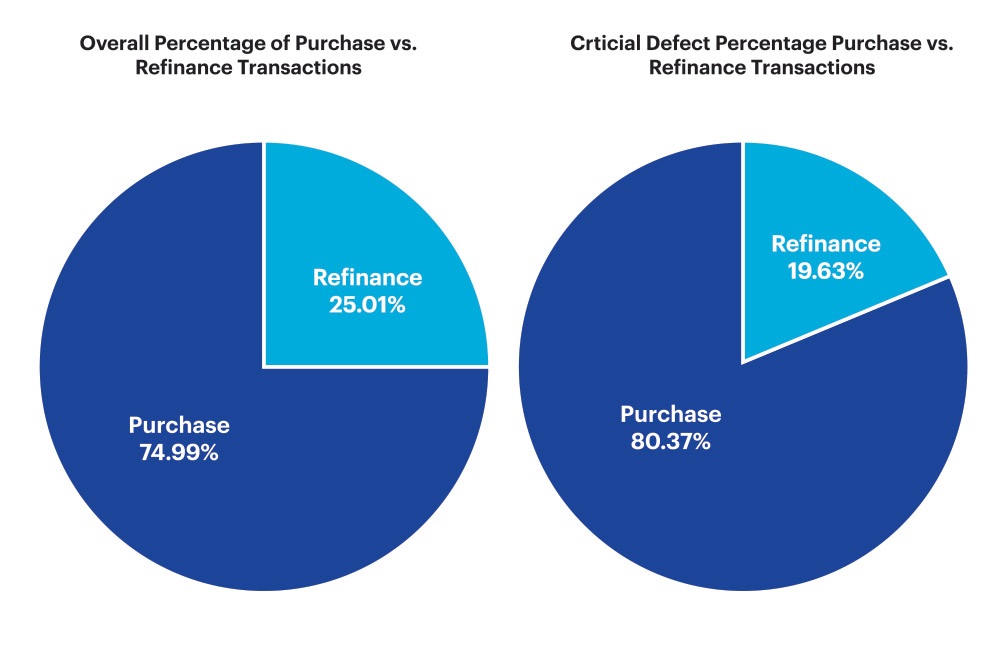
Figure 5: Q2 2017 critical defects broken down by loan purpose
Conclusion
Purchase transactions continued to outpace mortgage refinance originations in Q2 2017, with an increase of over 9% from Q1. The shift toward a purchase market, in combination with Legal/Regulatory/ Compliance trends described above resulted in critical defects during Q2 2017 being attributed primarily to Borrower/Mortgage Eligibility, Credit and Employment/Income.
The purchase driven market that has fueled overall production numbers and purchase transactions is inherently more prone to Borrower Eligibility and Credit defects than refinance transactions. Moreover, the new Administration that has indicated it will back down from maximum enforcement of regulations, has led to some easing of underwriting guidelines and expansion of product offerings.
As a result, the return to a focus on Employment/Income and Credit as the top sources of critical defects for originated loans is in line with the shifts experienced in both the marketplace and the regulatory environment from 2016 to 2017.
If purchase transactions continue to dominate mortgage originations and the regulatory environment is less pressured, we expect these trends in the critical defect rate to remain stable into future quarters.
About the ARMCO Mortgage QC Industry Trends Report
The ARMCO Mortgage QC Industry Trends Report represents a nationwide post-closing quality control analysis using data and findings derived from mortgage lenders utilizing the ACES Analytics benchmarking software.
This report provides an in-depth analysis of residential mortgage critical defects as reported during post-closing quality control audits. Data presented comprises net critical defects and is categorized in accordance with the Fannie Mae loan defect taxonomy.
About ARMCO
ARMCO – ACES Risk Management delivers web-based audit technology solutions, as well as powerful data and analytics, to the nation’s top mortgage lenders, servicers, investors and outsourcing professionals. A trusted partner devoted to client relationships, ARMCO offers best-in-class quality control and compliance software that provides U.S. banks, mortgage companies and service providers the technology and data needed to support loan integrity, meet regulatory requirements, reduce risk and drive positive business decisions. ARMCO’s flagship product, ACES Flexible Audit Technology®, is available at any point in the mortgage loan lifecycle, to any size lender, and is user-definable. ACES standardizes audit requirements, ties pre-funding reviews to post-closing quality control audits, enables seamless trend analysis, identifies credit, compliance and process deficiencies and helps create manageable action plans. For more information, visit visit www.acesquality.com or call 1-800-858-1598.
MEDIA CONTACT:
Jeri Yoshida
Yosh Communications
jeri@yoshcomm.com
310 651 0057
