ACES’ Mortgage QC Industry Trends Report represents an analysis of nationwide quality control findings based on data derived from the ACES Quality Management & Control Software.
Executive Summary
QC Industry Trends – Overview
QC Industry Trends – by Category
QC Industry Trends – by Loan Purpose
QC Industry Trends – by Loan Product Type
Economic Discussion
Conclusion
About this Report
Executive Summary
This report represents an analysis of post-closing quality control (QC) data derived from loan files analyzed by the ACES Quality Management and Control® benchmarking system during the second quarter of 2024 (Q2 2024). The report incorporates data from prior quarters, where applicable.
Findings for the Q2 2024 Trends Report were based on quality control data from tens of thousands of unique records. Volumes are essential to this analysis, and the included records reflect trends in overall origination volumes. However, data from additional lenders is added to this analysis once the lender’s QC review seasoning within the ACES software reaches the 12-month bar. Therefore, the overall volume in the QC Trends Report does not precisely mirror the overall market. All reviews and defect data evaluated for this report were based on post-close loan audits selected by lenders for full file reviews.
Defects are categorized using the Fannie Mae loan defect taxonomy. Data analysis for any given quarter does not begin until 90 days after the end of the quarter to allow lenders to complete the post-closing quality control cycle, resulting in a delay between the end of the quarter and our publication of the data.
As a note, we are moving up the publication of this report to earlier in the cycle. Fannie Mae's changes to the QC timeline, implemented in September 2023 have had a noticeable impact on timelines, such that we anticipate being able to publish this report approximately 30 days earlier than in previous cycles.
NOTE: A critical defect is defined as a defect that would result in the loan being uninsurable or ineligible for sale. The critical defect rate reflects the percentage of loans reviewed for which at least one critical defect was identified during the post-closing quality control review. All reported defects are net defects.
Summary of Findings
The overall critical defect rate rose to 1.81%, marking the second quarter of increase and the largest defect rate observed since Q1 2023. All four underwriting categories demonstrated a degradation in quality, with three out of the four showing double-digit percentage increases in defects. Purchase review and defect share increased this quarter, whereas refinance review and defect share both declined. FHA and VA loans saw improvements in defect share, while quality declined for conventional and USDA loans.
Highlights include the following findings:
- The overall critical defect rate increased 14.56% to 1.81% in Q2 2024, marking the second consecutive quarter of growth.
- Income/Employment remains the leading category of defects at 37.01%, followed by Assets at 14.29% and Credit at 9.79%.
- Defects increased in all four major underwriting categories, with Income/Employment defects rising the most quarter-over-quarter.
- Appraisal defects saw the most significant quarter-over-quarter growth across all categories, increasing by 98.33%.
- Insurance defects reversed course from Q1 2024, declining 91.99%.
- Lenders continued to prioritize purchase reviews over refinances, with defect share rising 2.71% for purchase transactions and declining 11.66% for refinances.
- Conventional and FHA review shares declined slightly this quarter. While VA review share increased somewhat, lenders significantly increased their reviews of USDA loans in Q2.
- FHA and VA loan performance improved tremendously over Q1, declining 35.26% and 56.57%, respectively. Conventional defect share increased by 13.59%, but the largest area of concern this quarter is USDA loan defects, which increased by 370.9%.
QC Industry Trends – Overview
While originations bounced back in Q2, the same could not be said for the critical defect rate. Originations for the quarter increased by 23.2% over Q11, whereas the critical defect rate increased by 14.56% over the same period to 1.81%. Q1 2024’s modest bump in the overall critical defect rate from 1.53% to 1.58% was concerning given the decline in origination volume from the prior quarter. With the resurgence of the spring buying season in Q2, a slight increase in defects – although disappointing – is less surprising, especially as the industry has largely “right-sized” its salaried operational staff to manage overhead amidst previous quarters of dwindling volume. Still, two consecutive quarters of increase is always troubling, as is observing the defect rate approach the critical 2% threshold.
Once again, origination performance ran contrary to expectations given the rate environment. Interest rates entered the quarter at 6.82%, up three basis points from the end of Q1, and continued to rise throughout the quarter. After peaking at 7.22% in early May, rates remained in the 7% range throughout most of the month. By early June, rates dipped into the high 6% range, ending the month and the quarter at 6.86%2. For comparison’s sake, origination volume in Q1 was the lowest observed since 2000 despite interest rates remaining in the 6.6 – 6.9% range, peaking at 6.94% around late February.
1 https://www.attomdata.com/news/most-recent/q2-2024-u-s-home-loan-origination-report/
2 https://fred.stlouisfed.org/series/MORTGAGE30US
Critical Defect Rate by Quarter: Q3 2023 — Q2 2024
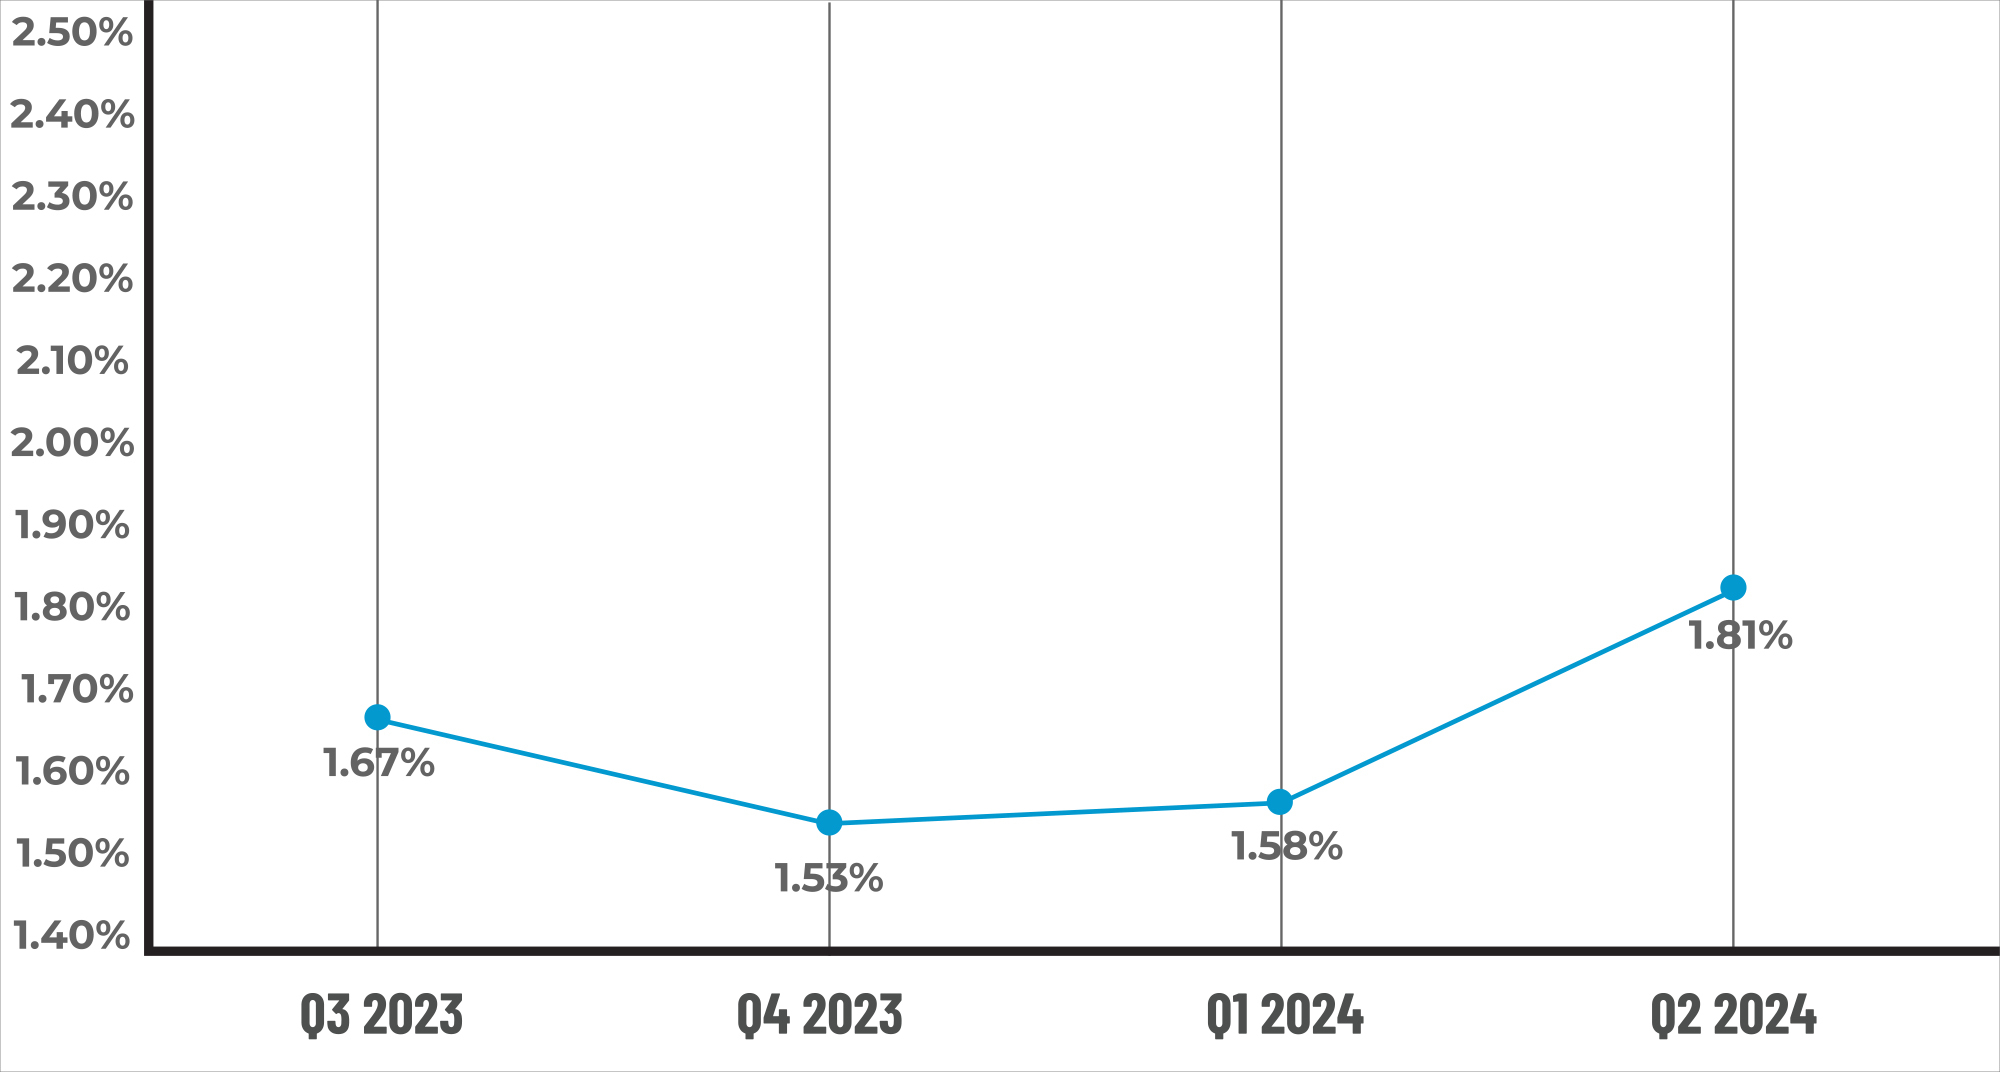
Figure 1 displays the percentage of loans with critical defects by quarter for Q3 2023 through Q2 2024.
QC Trends by Defect Category
While Income/Employment maintained its position as the leading area of defects this quarter, performance reversed course from Q1, with defects increasing by 58.03% to 37.01%. Assets and Liabilities rounded out the top three categories of defects this quarter, with Asset defects increasing by 22.03% to 14.29% and Credit rising by 8.1% to 9.79%. With Liabilities also growing by 26.07% to 9.09%, performance declined in all of the “Big 4” underwriting categories in Q2. In Q1, Assets and Credit ranked fourth and fifth, respectively, across all defect categories. However, it bears noting that Credit defects nearly doubled from Q4 2023 to Q1, resulting in the second-highest increase in defects observed that quarter.
From a sub-category perspective, the issues with Assets this quarter are primarily related to calculation/analysis, rising 373.82% from Q1. For Credit, eligibility remains the driver of defects in this category, though this quarter’s increase of 4.76% is moderate compared to the previous quarter’s 40% growth in defects. In the Income/Employment category, issues are also concentrated in calculation/analysis.
Looking back at the last three and half years of data, the Income/Employment category averages around a third of all reported defects. The fact that this critical area of repurchase risk continues to lead all defect categories is baffling, especially as the GSEs – Freddie Mac in particular – continue to penalize lenders for income errors.
Freddie Mac seller repurchases increased 29.1% in Q2 2024, reaching $430 million, with income verification reported as the leading cause of these requests. While Fannie Mae repurchase requests dipped quarter-over-quarter, it was not that long ago that lenders were reporting similar issues with Fannie. To their Credit, the GSEs seem to be listening to lenders’ concerns and have made strides to help lenders improve loan quality.
At the Mortgage Bankers Association’s annual convention in Denver in late October 2024, Fannie Mae President and CEO Priscilla Almodovar highlighted its advancements in digital verification, which have reduced repurchase risk by up to 75% for lenders using multiple automated tools. These tools include single-source validation to verify income and employment, launched officially in March 2024, and a self-employed income calculator also added in Q2 2024.
Freddie Mac’s Head of Client Engagement Kevin Kauffman pointed to LPA Choice, a new feature released in October 2024 inside Loan Product Advisor that provides lenders with feedback on income, assets and loan amount eligibility to enhance decision-making. In addition, Freddie’s Asset and Income Modeler (AIM) for asset, income and employment verification has been available since March 2022, and its fee-based repurchase alternative pilot launched in early 2024 is offering lenders some relief for defective, yet performing loans.
Clearly, the GSEs are doing what they can to help support lenders in mitigating loan defects. Given the relative “newness” of some of these initiatives compared to this quarter’s data, it is our hope and expectation that income/employment defects will improve as lenders take advantage of these tools and initiatives.
Outside of the “Big 4” categories, Appraisals is always an area of interest from a defect perspective. After Q3 2022’s low of 2.74%, Appraisal defects have averaged around 3.96%, which makes Q2’s 7.14% share somewhat concerning. This area was also the largest category for defect growth observed this quarter, increasing by 98.33% from Q1.
On the other end of the spectrum, last quarter’s unusual increase in Insurance defects normalized in Q2, declining by 91.99%. This improvement would seem to indicate that the prior quarter’s rise was a momentary blip. However, the persistent issues related to homeowners’ insurance make this an area to watch for the foreseeable future.
In more positive news, two of last quarter’s top three defect categories – Legal/Regulatory/Compliance and Loan Documentation – both improved significantly in Q2. Legal/Regulatory/Compliance defects declined by 64%, representing the second-largest area of improvement this quarter, while Loan Documentation dropped by 41.43%.
Critical Defects by Fannie Mae Category: Q2 2024
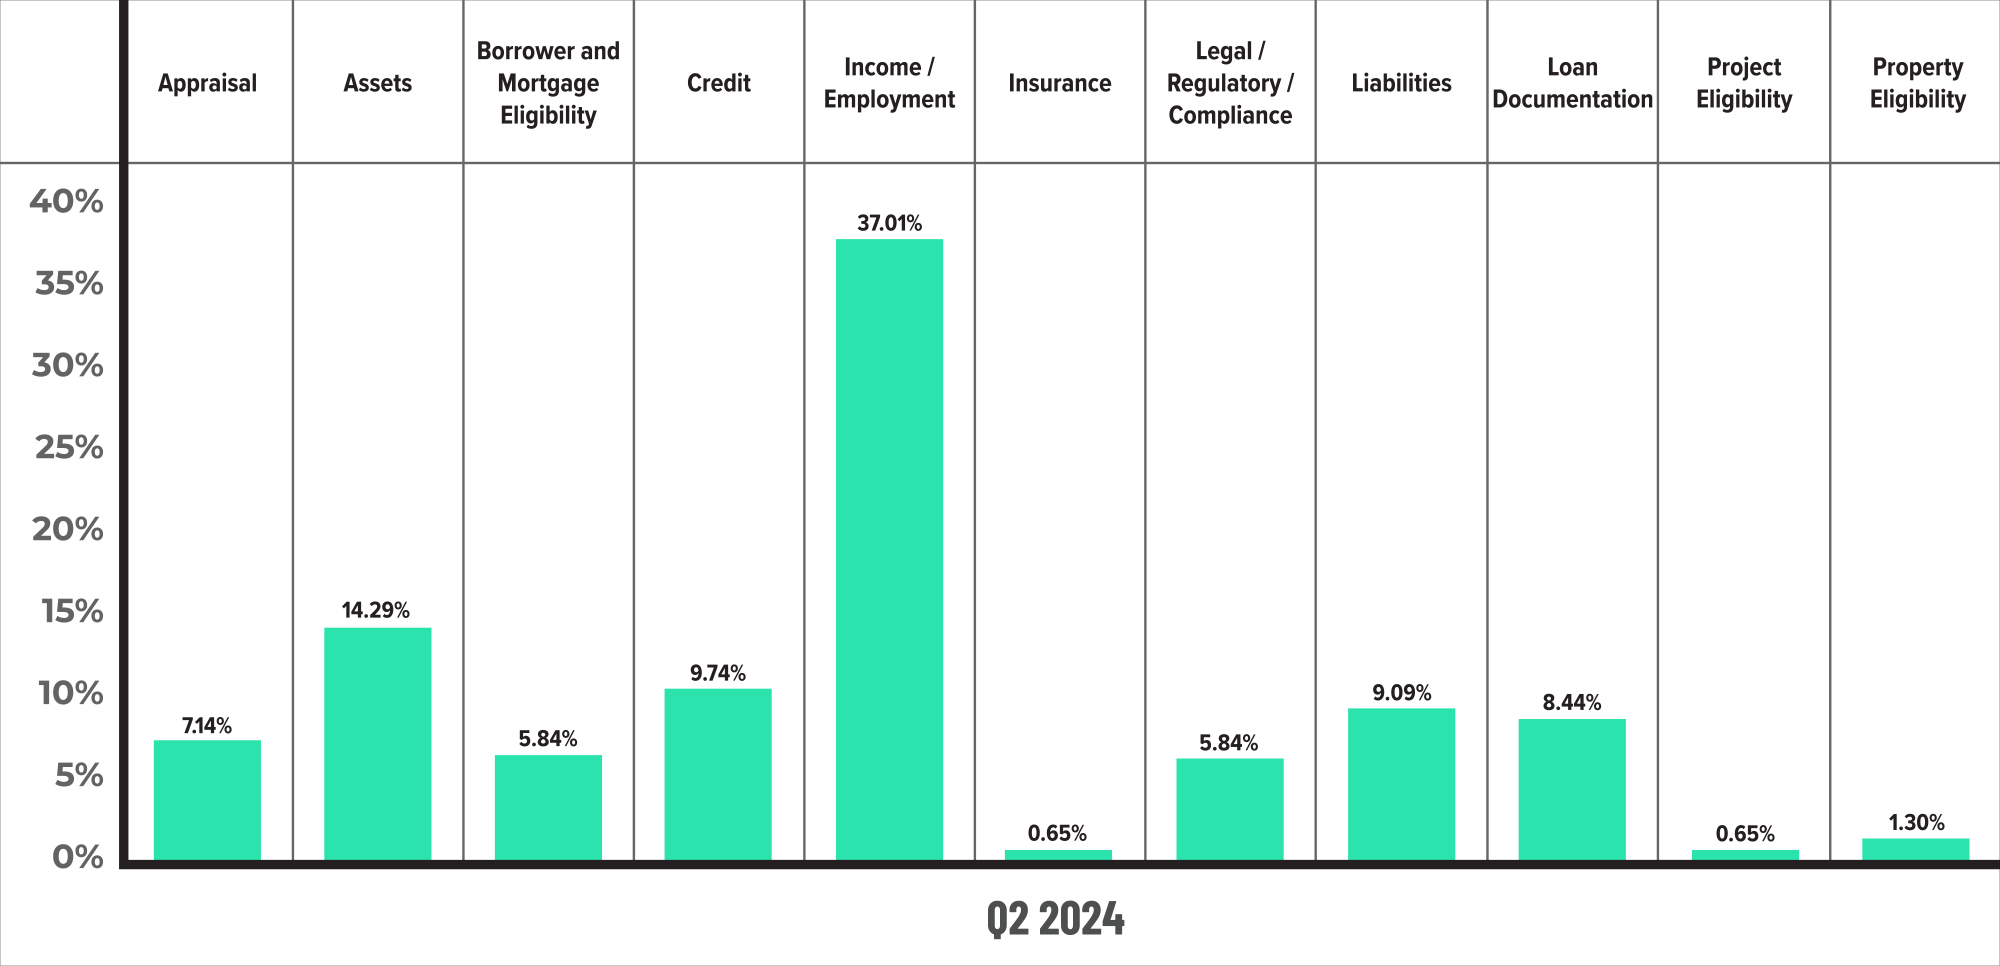
Figure 2 displays the dispersion of critical defects across Fannie Mae categories for Q2 2024. Please note that totals shown may not add up to 100%, as categories with negligible defects have been omitted.
Critical Defects by Fannie Mae Category: Q1 2024 vs. Q2 2024
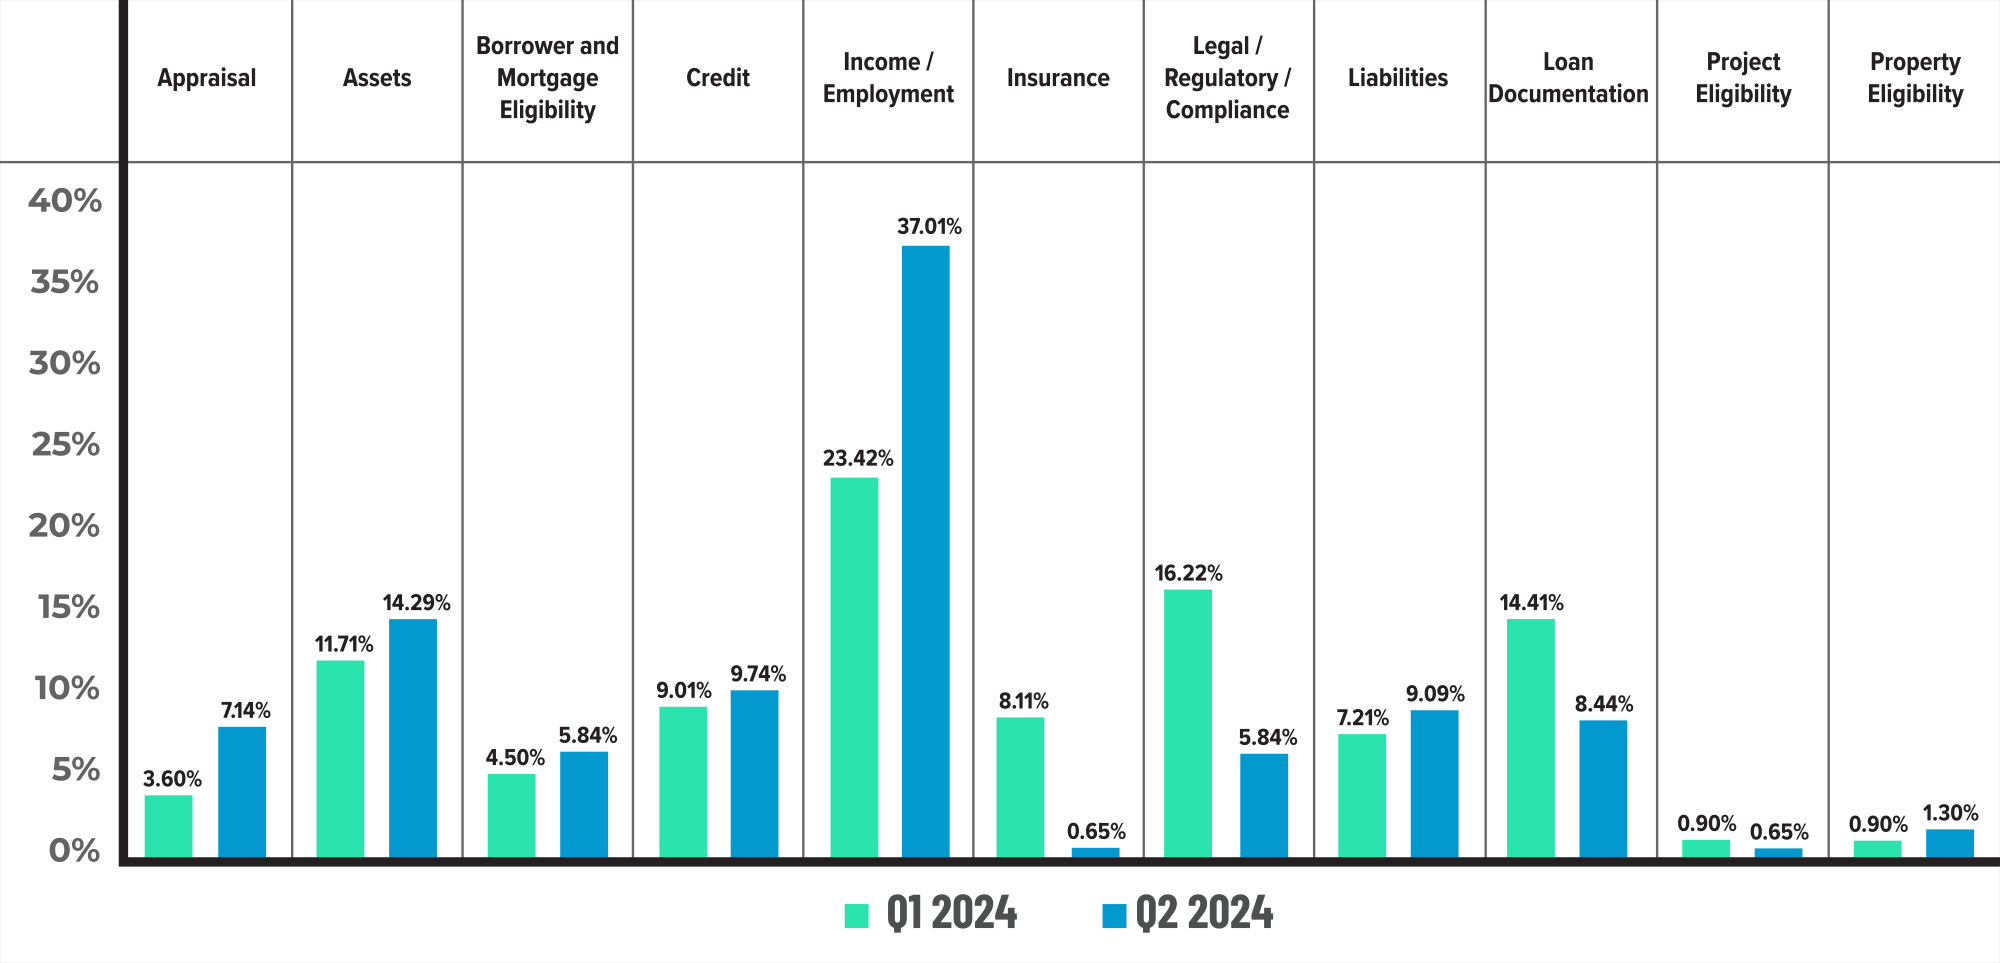
Figure 3 displays the critical defect rate by Fannie Mae category, comparing Q1 2024 to Q2 2024.
Critical Defects by Fannie Mae Underwriting Sub-category: Q2 2024
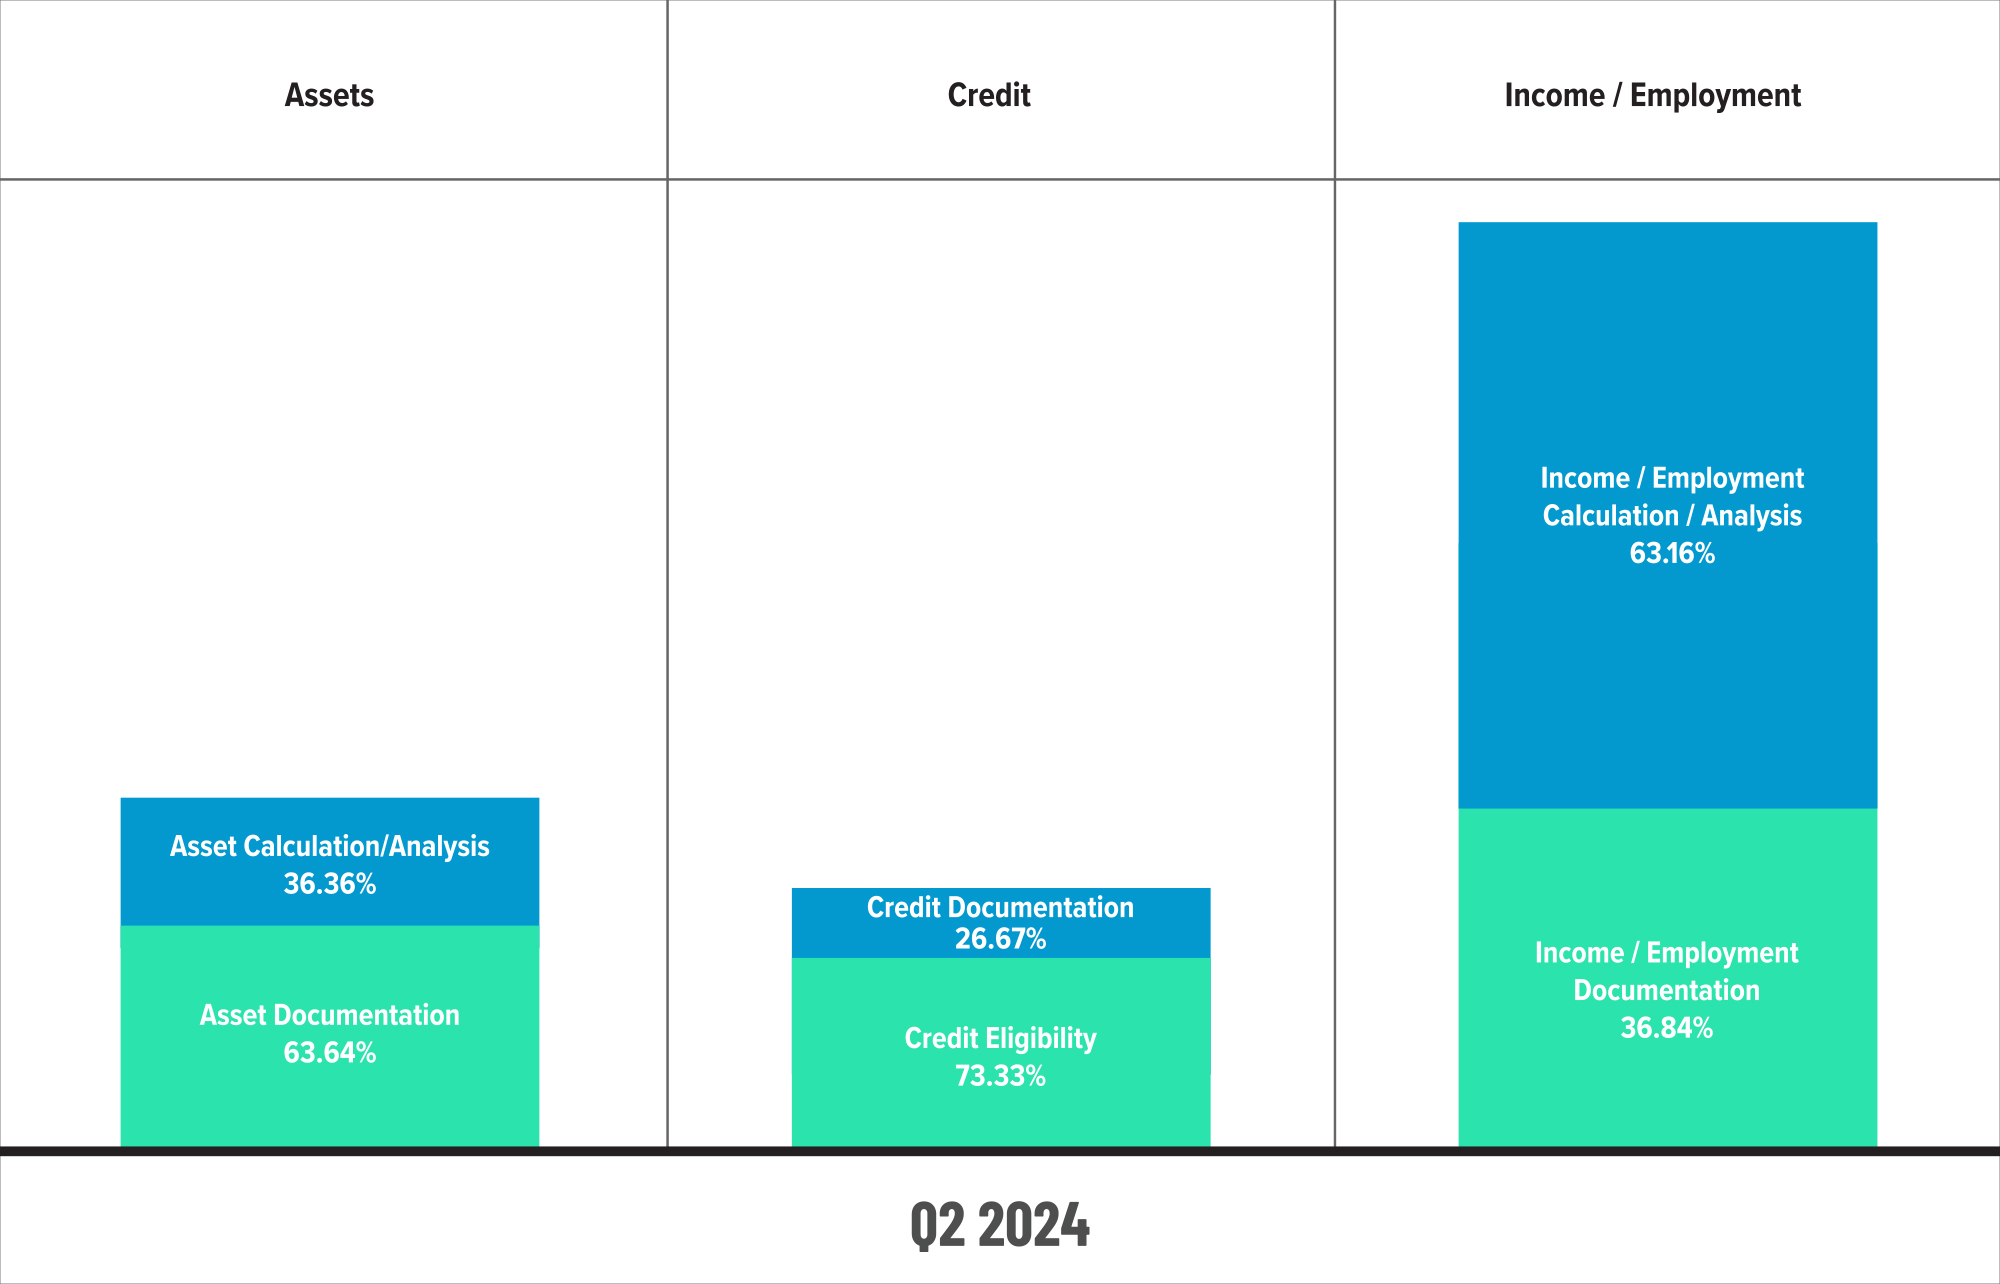
Figure 4 displays sub-category information for Q2 2024 within the Assets, Credit and Income/Employment categories.
Critical Defects by Fannie Mae Underwriting Sub-category: Q1 2024 vs. Q2 2024
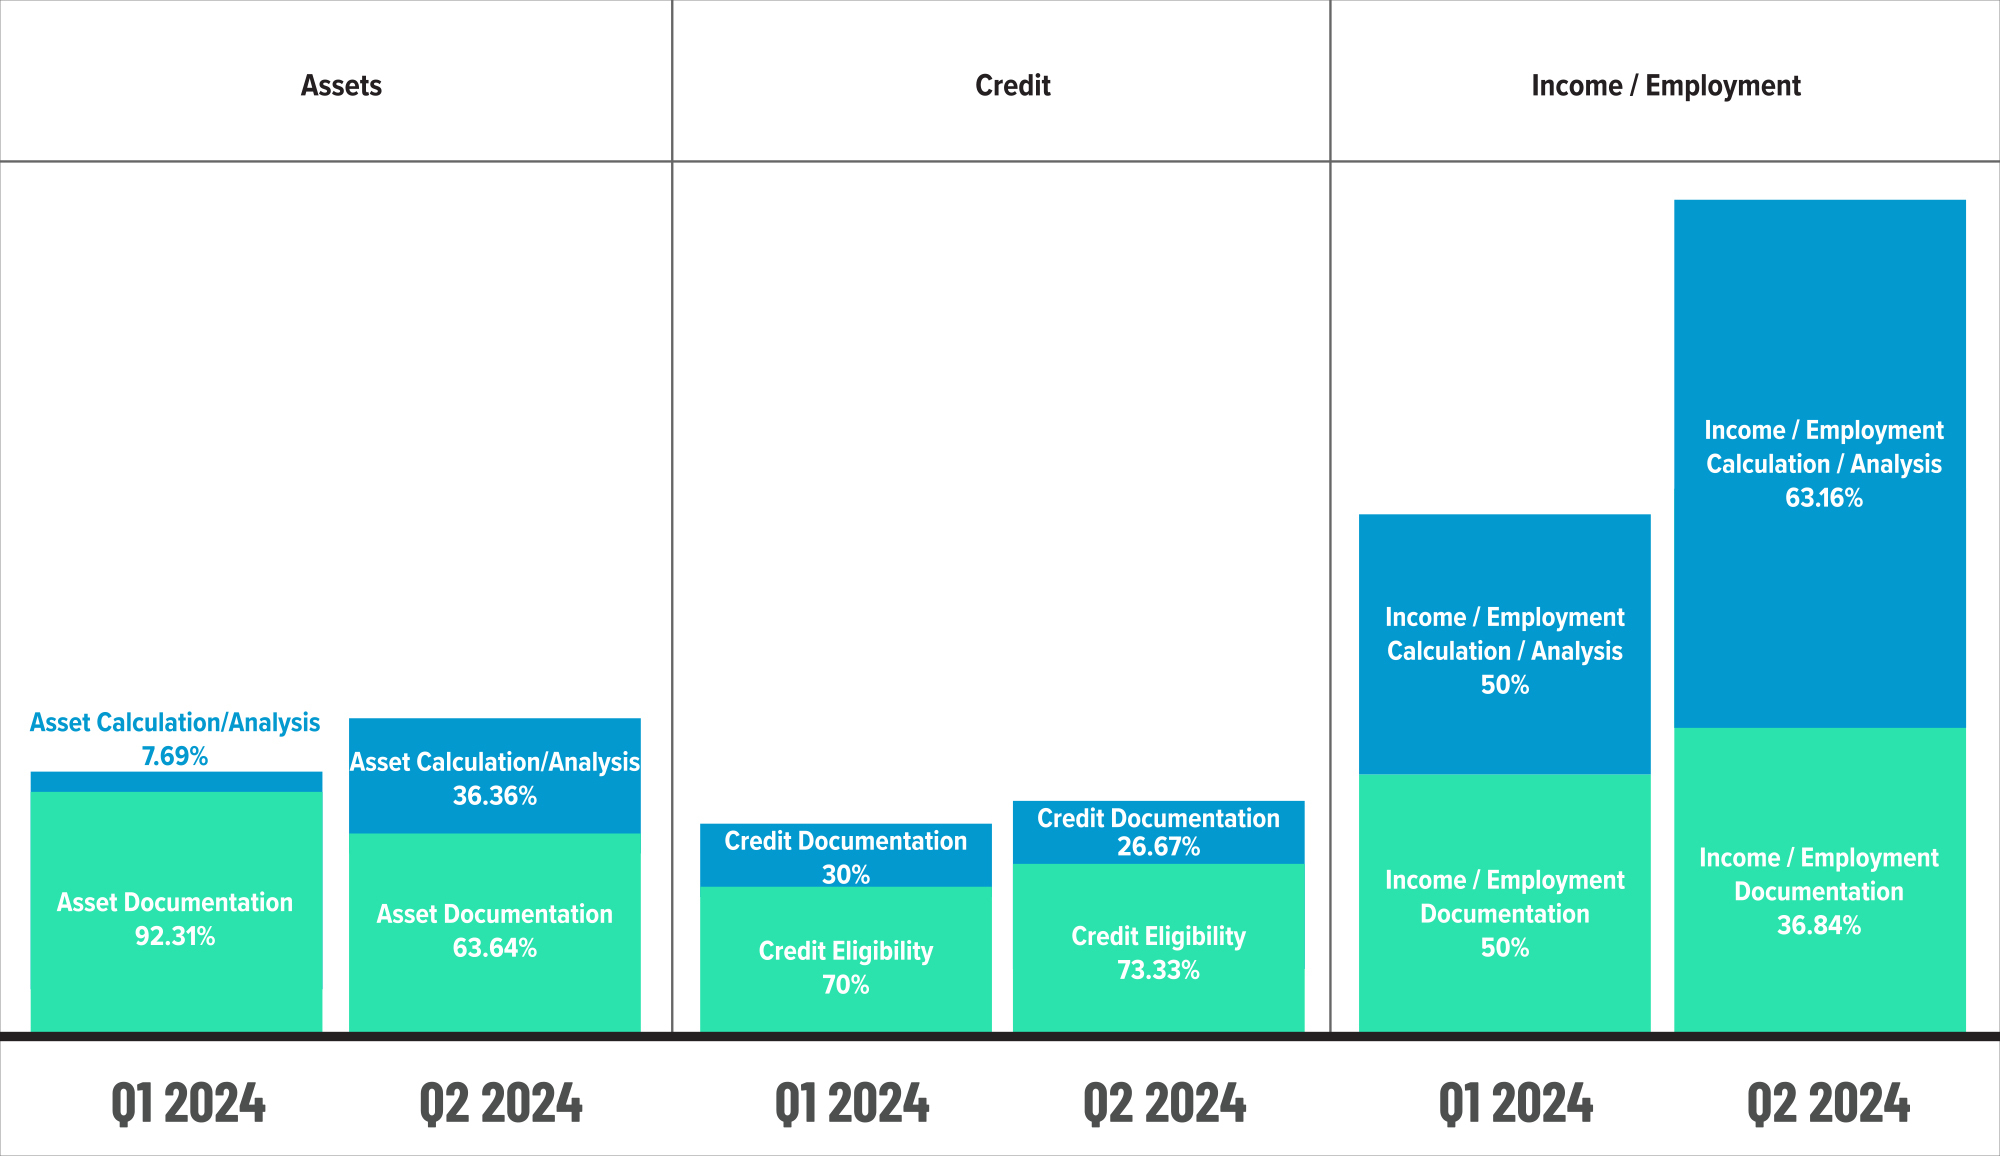
Figure 5 displays sub-category information within the Assets, Credit and Income/Employment categories, comparing Q1 2024 to Q2 2024.
QC Trends by Loan Purpose
Unsurprisingly, lenders increased their reviews of purchase loans in Q2, accounting for 91.13% of review share compared to 87.55% in Q1. The shift in review share likely impacted the changes observed in defects, as purchase defect share increased by 2.71% while refinance defect share declined by 11.66%. As noted in last quarter’s report, lenders should continue to carefully evaluate refinance transactions in the current market, as interest rates have yet to significantly decrease, and ensure an appropriate balance between purchase and refinance loans to effectively monitor and manage risk across these areas.
Defects by Loan Purpose: Q2 2024

Figure 6 displays the loans reviewed and critical defects by loan purpose for Q2 2024.
QC Trends by Loan Product Type
In a reversal from the prior quarter, lenders pulled back on reviews of conventional loans, albeit slightly, with review share declining by 1.3%. FHA review share also declined in Q2 by 1.21%. Instead, lenders turned their attention to VA and USDA loans, increasing review share for these loan types by 2.85% and 37.16%, respectively. From a defect share perspective, lenders saw performance improve for FHA loans by 35.26% and VA loans by 56.57%. On the other hand, conventional defect share increased by 13.59% over Q1, while USDA defect share skyrocketed by 370.9%.
While this increase is concerning, it is vital to consider overall market and review share. USDA loans generally do not comprise a significant portion of lenders’ overall origination mix and typically account for less than 2.5% of all loans reviewed in this report. Because these are highly complex loans lenders may originate infrequently, any given quarter may see a higher number of errors. Furthermore, with that small pool of loans, those errors can have an outsized impact, and that’s likely what we’re seeing in Q2’s defect share. However, any increase in defects should be a signal to lenders that extra vigilance is needed to ensure momentary lapses do not turn into long-term trends.
Defects by Loan Product Type: Q2 2024

Figure 7 displays the loans reviewed and critical defects by loan type for Q2 2024.
Economic Discussion
In the second quarter of 2024, the mortgage industry experienced improving financial conditions, particularly among publicly reporting non-bank lenders. Although not all lenders had reported their earnings at the time of publication, the data available pointed to a positive trend in profitability, marking an encouraging shift for lenders that had not seen profits for over a year. This improvement was driven by several factors, including a modest increase in refinance volumes, higher gain-on-sale margins, and improved expense management. Notably, the average gain-on-sale margin reached its highest level since the first quarter of 2022, indicating a more favorable environment for loan sales.
Looking forward, the third quarter defect rate performance is expected to be of significant interest, especially in light of the Federal Reserve’s decision to lower interest rates by half a percent in September. This rate cut, coupled with a rise in refinance activity reported by many lenders, may influence defect rates in the coming months. Historically, defect rates are higher for purchase loans than for refinances, suggesting that the increased focus on refinance transactions could have a stabilizing effect on overall defect rates.
Several factors will shape the mortgage industry’s outlook going forward. The evolving interest rate environment is expected to boost refinance volumes, which could positively impact defect rates. Additionally, while home prices continued to appreciate in the second quarter as demand outpaced supply in most major markets, the pace of appreciation has slowed somewhat. This deceleration may help balance affordability challenges and maintain steady purchase activity. With these trends and recent rate cuts, the industry enters the latter half of 2024 with cautious optimism.
Conclusion
The ACES QC Industry Trends Report for Q2 2024 marks a pivotal shift in quality control trends, with the critical defect rate reaching 1.81%, the highest since Q1 2023. This increase follows five prior quarters of stability and gradual improvement, underscoring the need for lenders to intensify focus on loan quality amidst rising origination volumes. Key drivers of this shift include spikes in defects within key underwriting categories, reflecting complex borrower qualification scenarios and persistent calculation/analysis challenges. While purchase loan reviews continue to dominate, both conventional and USDA loans exhibited notable declines in quality, contrasting with FHA and VA improvements. This period reflects an industry balancing operational pressures with rigorous compliance demands, underscoring the value of a robust QC program to identify and rectify areas of concern before they create a long-term impact on loan performance and lender profitability.
About the ACES Mortgage QC Industry Trends Report
The ACES Mortgage QC Industry Trends Report represents a nationwide post-closing quality control analysis using data and findings derived from mortgage lenders utilizing the ACES Analytics benchmarking software.
This report provides an in-depth analysis of residential mortgage critical defects as reported during post-closing quality control audits. Data presented comprises net critical defects and is categorized in accordance with the Fannie Mae loan defect taxonomy.
About ACES
ACES Quality Management is the leading provider of enterprise quality management and control software for the financial services industry. The nation’s most prominent lenders, servicers and financial institutions rely on ACES Quality Management & Control® Software to improve audit throughput and quality while controlling costs, including:
- 70% of the top 20 independent mortgage lenders;
- 7 of the top 10 loan servicers;
- 11 of the top 30 banks; and
- 3 of the top 5 credit unions in the United States.
Unlike other quality control platforms, only ACES delivers Flexible Audit Technology, which gives independent mortgage lenders and financial institutions the ability to easily manage and customize ACES to meet their business needs without having to rely on IT or other outside resources. Using a customer-centric approach, ACES clients get responsive support and access to our experts to maximize their investment.
For more information, visit www.acesquality.com or call 1-800-858-1598.
Media Contact: Lindsey Neal | DepthPR for ACES | (404) 549-9282 | lindsey@depthpr.com
View all reports