ACES’ Mortgage QC Industry Trends Report represents an analysis of nationwide quality control findings based on data derived from the ACES Quality Management & Control Software.
Executive Summary
QC Industry Trends – Overview
QC Industry Trends – by Category
QC Industry Trends – by Loan Purpose
QC Industry Trends – by Loan Product Type
Economic Discussion
Conclusion
About this Report
Executive Summary
This report represents an analysis of post-closing quality control (QC) data derived from loan files analyzed by the ACES Quality Management and Control® benchmarking system during the third quarter of 2024 (Q3 2024). The report incorporates data from prior quarters, where applicable.
Findings for the Q3 2024 Trends Report were based on quality control data from tens of thousands of unique records. Volumes are essential to this analysis, and the included records reflect trends in overall origination volumes. However, data from additional lenders is added to this analysis once the lender’s QC review seasoning within the ACES software reaches the 12-month bar. Therefore, the overall volume in the QC Trends Report does not precisely mirror the overall market. All reviews and defect data evaluated for this report were based on post-close loan audits selected by lenders for full file reviews.
Defects are categorized using the Fannie Mae loan defect taxonomy. Data analysis for any given quarter does not begin until 90 days after the end of the quarter to allow lenders to complete the post-closing quality control cycle, resulting in a delay between the end of the quarter and our publication of the data.
As a note, we are moving up the publication of this report to earlier in the cycle. Fannie Mae’s changes to the QC timeline, implemented in September 2023, have had a noticeable impact on timelines, such that we anticipate being able to publish this report approximately 30 days earlier than in previous cycles.
NOTE: A critical defect is defined as a defect that would result in the loan being uninsurable or ineligible for sale. The critical defect rate reflects the percentage of loans reviewed for which at least one critical defect was identified during the post-closing quality control review. All reported defects are net defects.
Summary of Findings
The overall critical defect rate decreased in Q3 2024 to 1.51%, reversing a three-quarter-long trend of increases. Defects increased in three of the four major underwriting categories. Purchase review share declined this quarter while defect share increased nominally. Conversely, refinance review share increased, and defect share decreased. Loan quality improved for both conventional and USDA loans, while defects increased for FHA and VA loans.
Highlights include the following findings:
- The overall critical defect rate declined from Q2 to Q3 by nearly 17%, ending the quarter at 1.51%.
- Income/Employment was again the leading category of defects at 25%, followed by Assets at 16.67%. Credit and Loan Documentation tied for the third most defects at 12.12% each.
- Insurance defects increased more than four-fold from a nominal .65% in Q2 to 3.03% in Q3, demonstrating a volatile pattern since Q1 when the share stood at 8%.
- Mirroring the origination environment in Q3, lenders increased their reviews of refinances while defect share declined.
- Purchase defect share increased despite a decrease in purchase reviews.
- Conventional review share increased slightly in Q3, while FHA, USA and VA loan reviews decreased.
- Defects declined significantly for conventional and USDA loans this quarter, while FHA defect share increased by 25%.
- VA defect share increased significantly in Q3, though primarily driven by a temporary phenomenon.
QC Industry Trends – Overview
Building off the momentum of a strong spring homebuying season, origination volume increased 1.9% in Q3, though the growth was driven largely by a two-year high in refinances1. The surge in refinances is unsurprising, given that interest rates fell 87 basis points (bps) from 6.95% in early July to 6.08% by the end of September2. Unlike in prior quarters, the majority of refinances in Q3 were of the “traditional” kind, with borrowers seeking simply to lock in a lower rate. These transactions are far less complicated than other refinance scenarios, which were more prevalent in previous quarters when interest rates were higher. Less complex transactions usually mean fewer errors so the drop in the overall critical defect rate this quarter makes sense.
1 https://www.attomdata.com/hnr/q3-2024-u-s-loan-mortgage-origination-report/
2 https://fred.stlouisfed.org/series/MORTGAGE30US
Critical Defect Rate by Quarter: Q4 2023 — Q3 2024
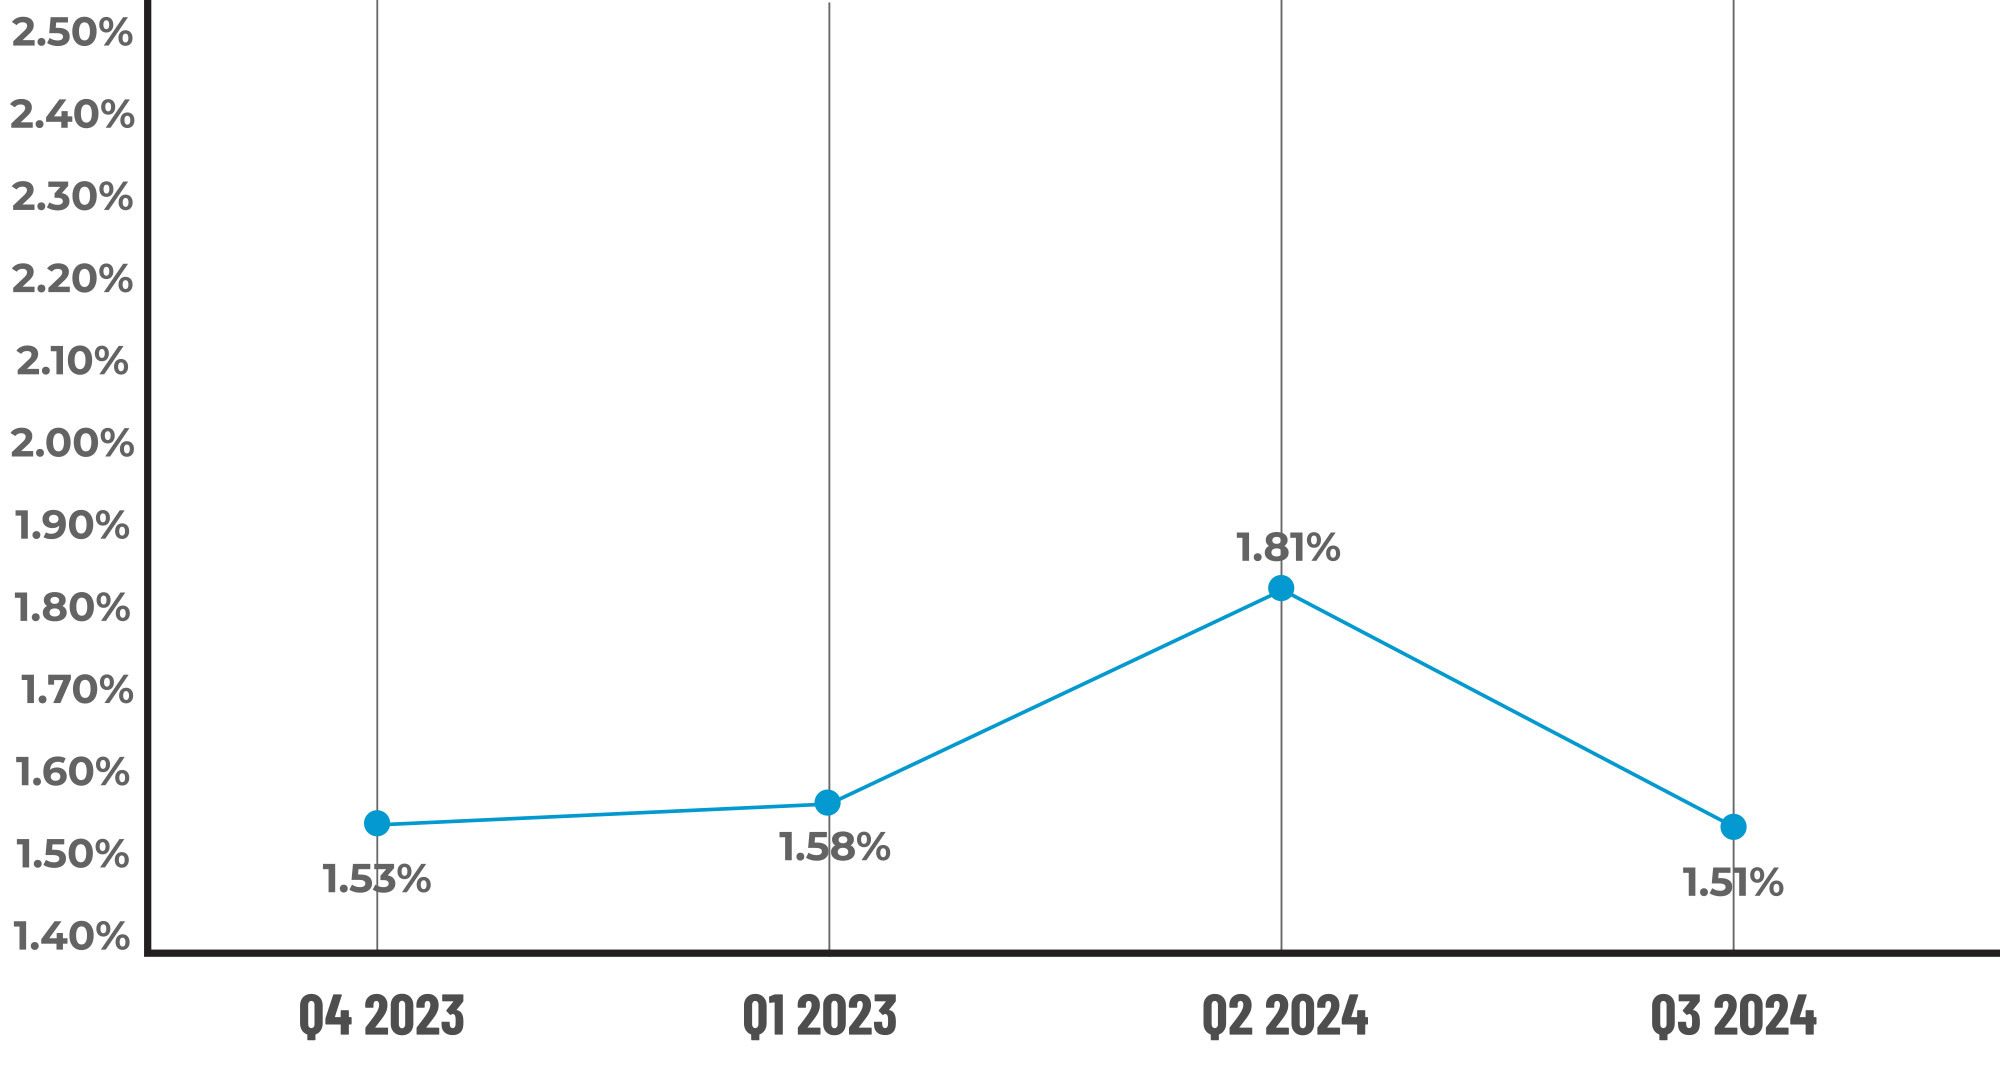
Figure 1 displays the percentage of loans with critical defects by quarter for Q4 2023 through Q3 2024.
QC Trends by Defect Category
Although it was, once again, the largest category of defects, the Income/Employment category’s performance improved from Q2, declining by 32.45% to 25%. Following income/employment, Assets was the second largest category of defects with a share of 16.67%, representing a 16.66% quarter-over-quarter increase. Credit and Loan Documentation tied for the third largest categories of defects at 12.12% each. While Credit defects increased by 24.44% over Q2, Loan Documentation defects rose 43.6%, making it the fourth largest category increase observed this quarter.
Of the Big 4 underwriting categories, Income/Employment was the only category in which performance improved, though Liabilities defects remained flat quarter-over-quarter. The sub-category analysis showed the performance gains made in Income/Employment were driven by a 34.2% decrease in Documentation-related defects. While it’s always heartening to see lenders making improvements in this area, the rise in defects in the Calculation/Analysis and Eligibility sub-categories ⎯ the latter of which has been non-existent for the last two quarters ⎯ is cause for concern.
The Assets category tells a similar story, with Documentation errors decreasing while Calculation/Analysis rose and Eligibility errors re-emerged. Conversely, the Credit sub-category analysis shows Documentation was the driver behind this quarter’s rise in defects in this category, increasing 87.48% from Q2.
While its relative share remained small in Q3, insurance outweighed all defect categories in terms of growth. Insurance defects historically account for a tiny slice of overall QC irregularities but have become more prevalent in recent quarters. Q1 2024 was the first observed spike in Insurance defects. As noted in that quarter’s report:
Insurance defects have generally been excluded from this report, given the negligible number of defects observed in this category from quarter to quarter. That was not the case in Q1, which saw defects reach 8.11%. To put this into perspective, Insurance defects accounted for less than 1% of all defects in both 2022 and 2023. The Insurance defect category encompasses all levels of insurance on a loan, including hazard insurance, flood insurance and, if applicable, mortgage insurance. Insurance in general, but hazard insurance and rising premiums in particular, is a very hot topic in the industry. Thus, this category’s rapid rise in defect percentage warrants increased attention moving forward.
Generally speaking, a one-quarter spike warrants observation only. However, following Q2’s decline, Insurance defects rose once again in Q3, increasing from 0.65% to 3.03%, indicating the need for QC teams to move from observation to action.
As weather-related natural disasters increase in frequency and severity, home insurers have responded to the increased risk by dramatically increasing premiums or simply ceasing to issue new policies in heavily impacted regions. In 2023, an “unprecedented number of billion-dollar disasters—28 in total—struck the U.S.3,” resulting in “soaring home insurance premiums,” which caused “major disruptions for mortgage lenders with policy premiums increasing almost 9%,” according to digital insurance agency Matic.
While increases in policy premiums certainly impact existing homeowners, the rising cost of insurance can also push borrowers’ debt-to-income ratios too high to qualify for the mortgage they seek. Changes in insurance can also contribute to critical delays in closings. Matic reported that “lenders have seen an increase in borrowers whose debt-to-income ratio becomes too high to qualify for the original mortgage once the cost of insurance was factored in.” Nearly 60% of lenders, according to Matic4, experienced critical delays in loan closings as borrowers sought homeowner’s insurance.
This volatility will likely continue into Q4 as the insurance industry’s reaction to record-setting losses from weather-related claims varies dramatically from company to company and region to region, affecting new and existing policies alike. Insurance has not been a “high priority” defect category historically, but with the persistent challenges facing the industry in this area, lenders should shift their thinking and scrutinize this aspect of their originations more closely for the foreseeable future.
3 https://www.noaa.gov/news/us-struck-with-historic-number-of-billion-dollar-disasters-in-2023#:~:text=An%20unprecedented%20number%20of%20billion,with%20a%20record%2Dwarm%20December
4 https://matic.com/partner-articles/home-insurance-problems-mortgage-lenders/
Critical Defects by Fannie Mae Category: Q3 2024
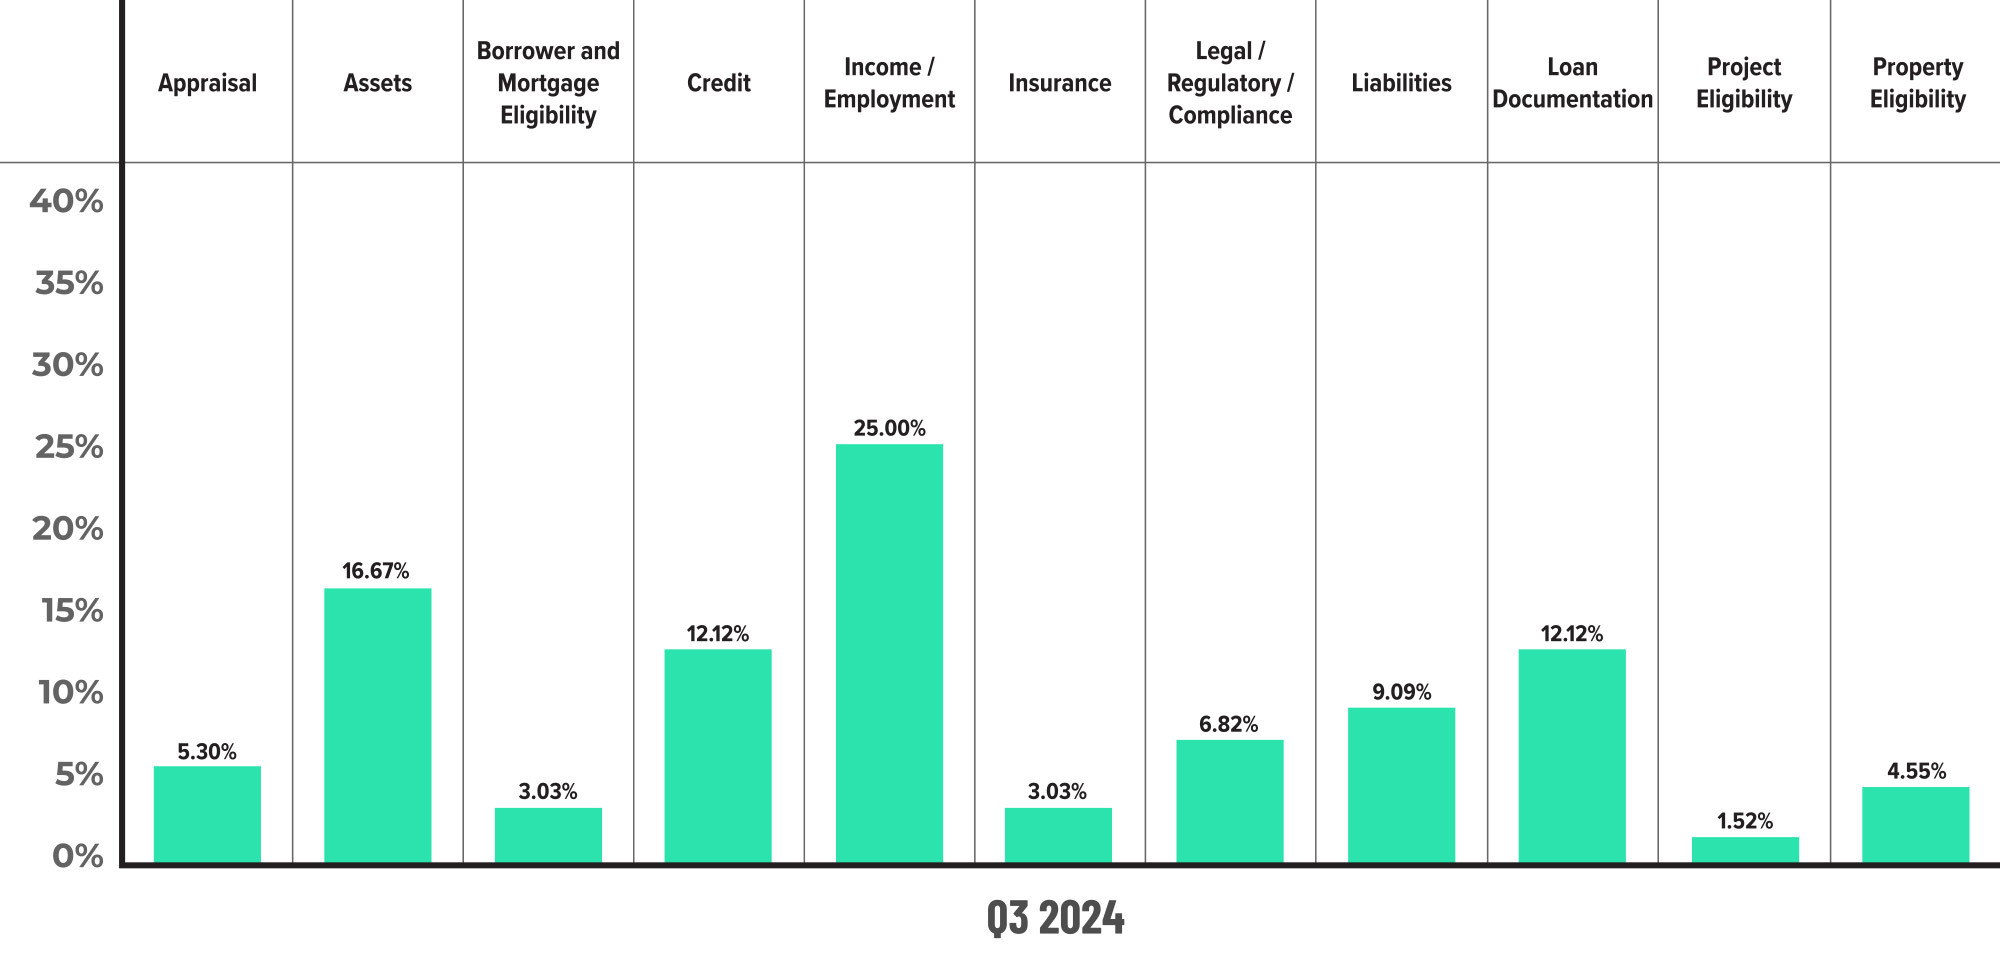
Figure 2 displays the dispersion of critical defects across Fannie Mae categories for Q3 2024. Please note that totals shown may not add up to 100%, as categories with negligible defects have been omitted.
Critical Defects by Fannie Mae Category: Q2 2024 vs. Q3 2024
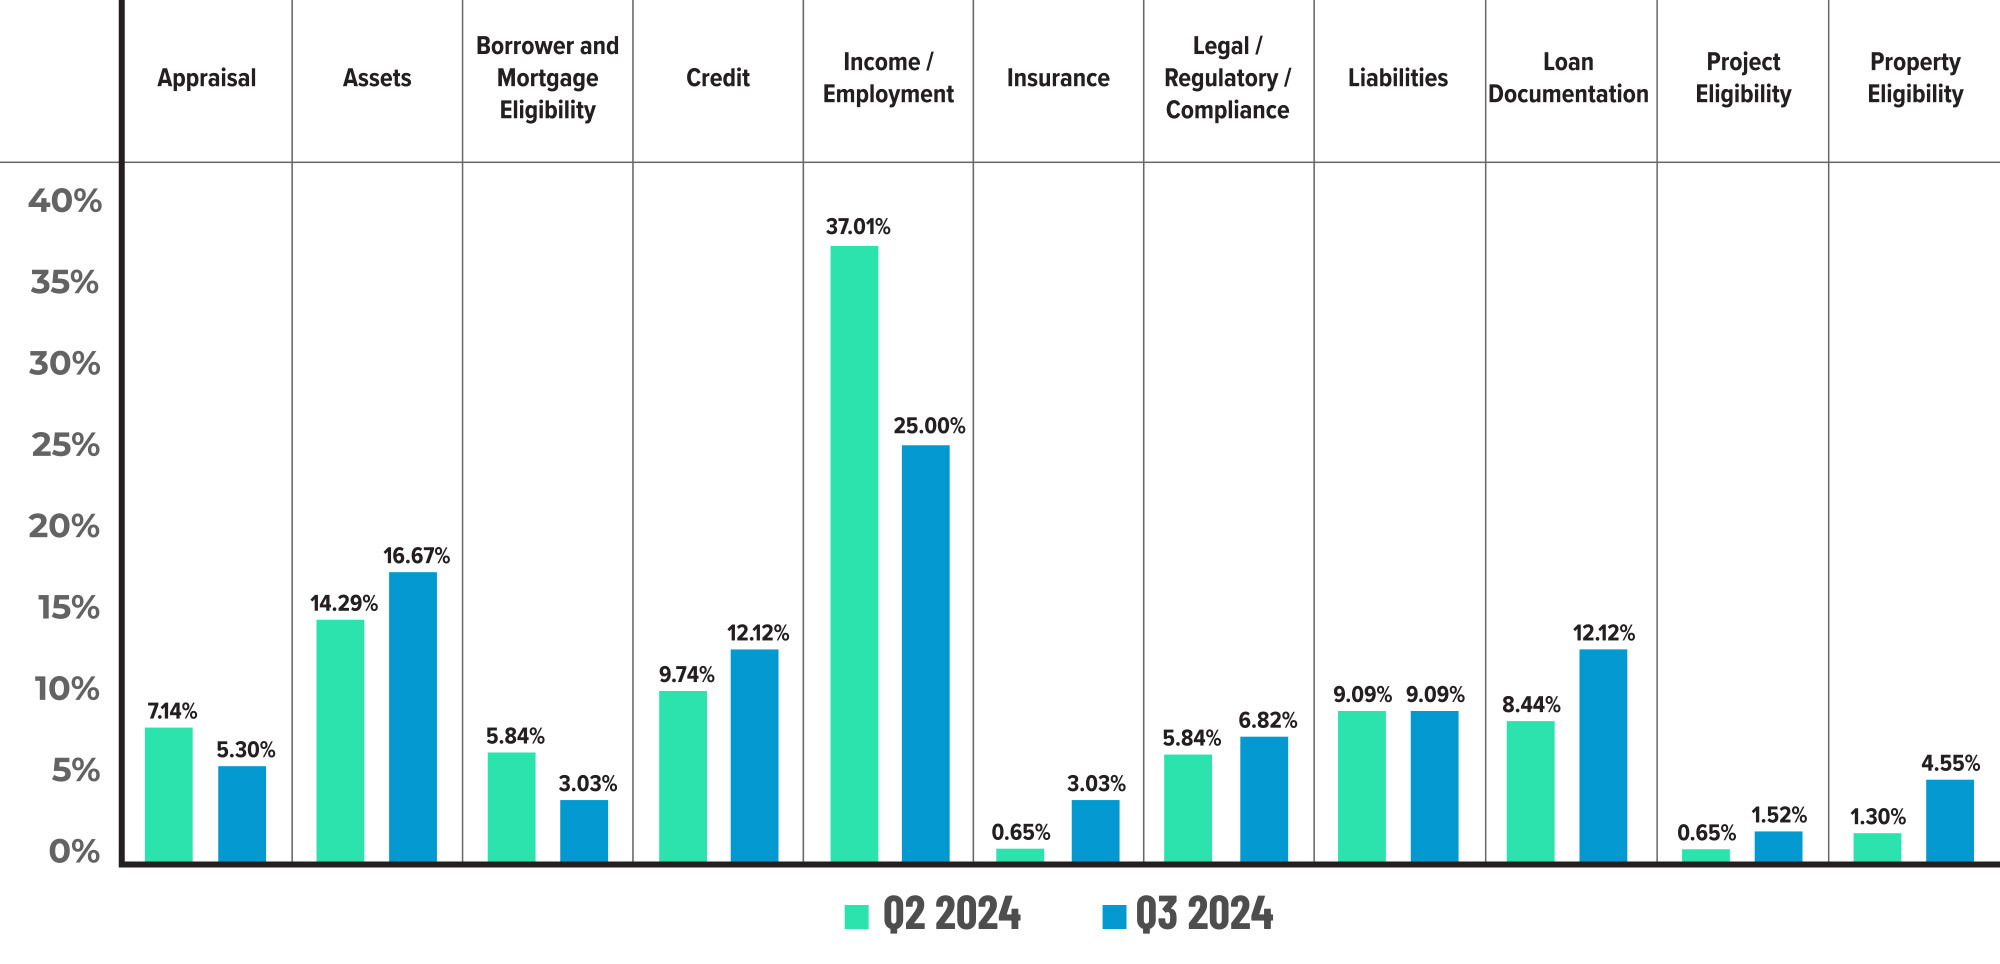
Figure 3 displays the critical defect rate by Fannie Mae category, comparing Q2 2024 to Q3 2024.
Critical Defects by Fannie Mae Underwriting Sub-category: Q3 2024
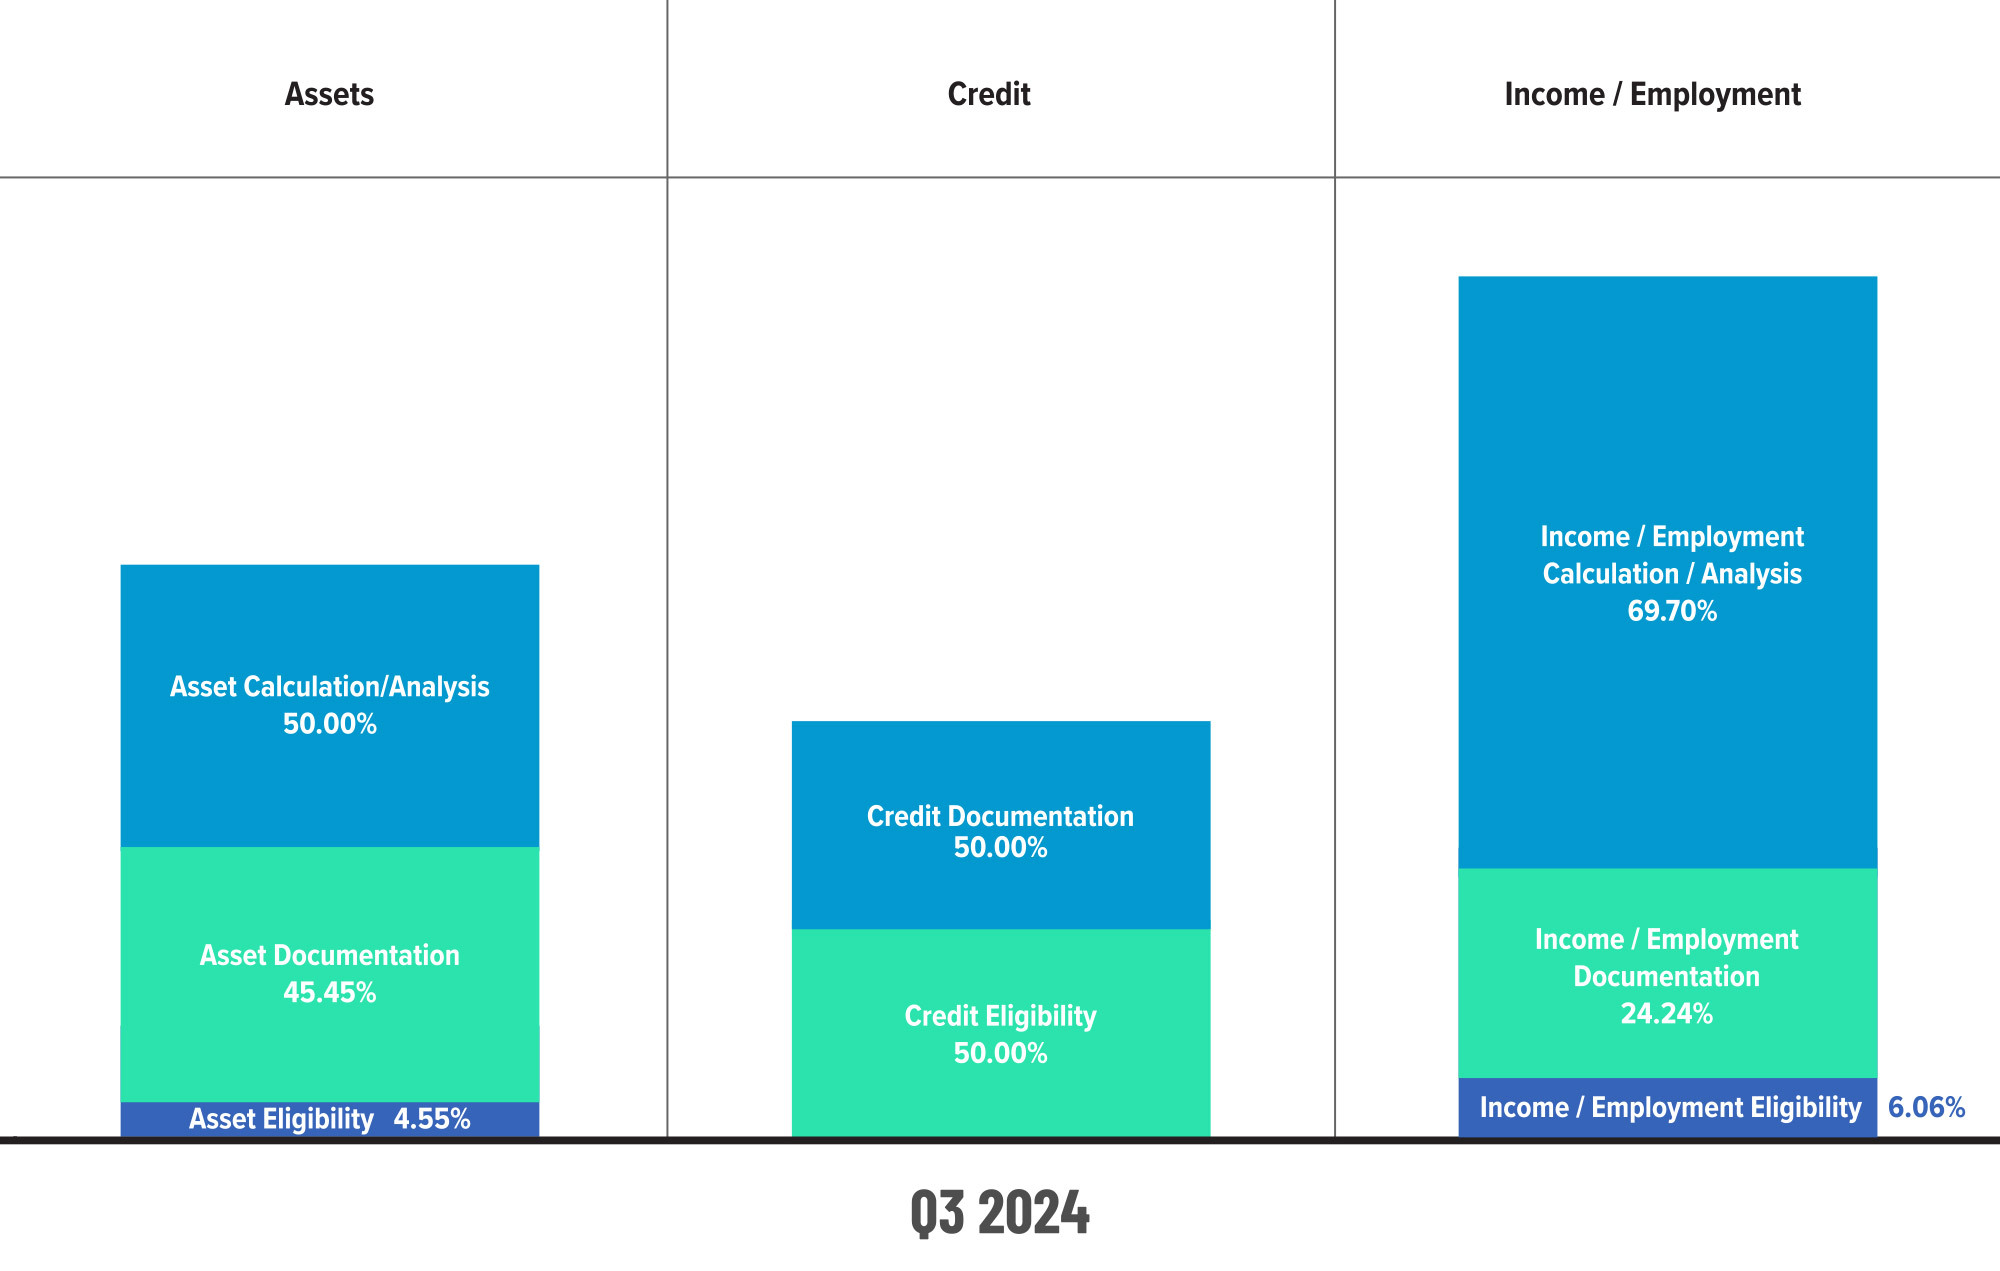
Figure 4 displays sub-category information for Q3 2024 within the Assets, Credit and Income/Employment categories.
Critical Defects by Fannie Mae Underwriting Sub-category: Q2 2024 vs. Q3 2024
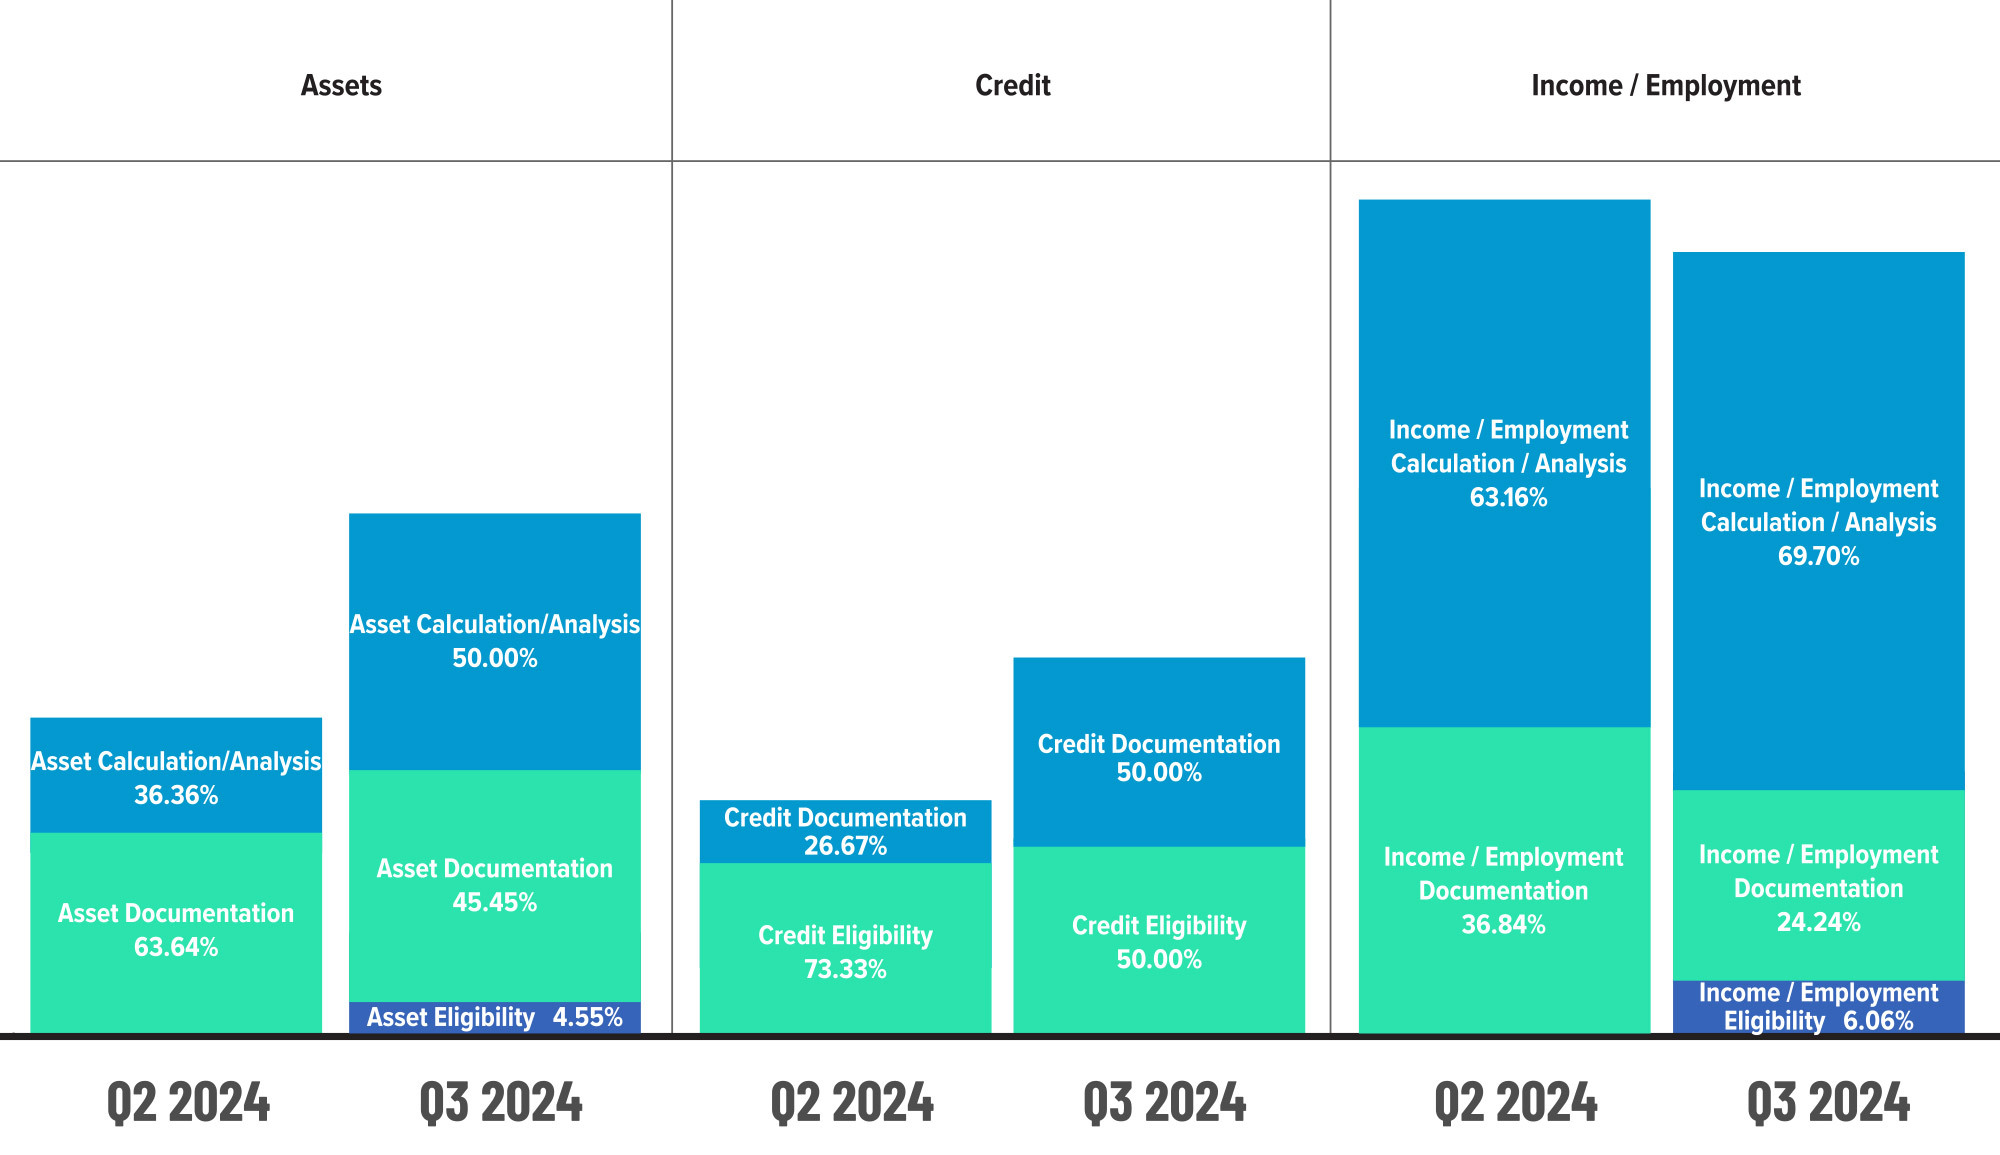
Figure 5 displays sub-category information within the Assets, Credit and Income/Employment categories, comparing Q2 2024 to Q3 2024.
QC Trends by Loan Purpose
The tiny uptick in originations in Q3 represents a trend that began in Q2’s spring buying season, a continuity not seen in three years. With mortgage rates dropping close to 6% for a 30-year fixed loan by the end of Q3 2024, refinances surged by 6.9% over the previous quarter—the highest level of refinancing in two years as rates approached 6% toward the end of Q3, driving a 19.39% increase in refi review share. Refis are notoriously easier to verify and process than purchases because much of the needed data and documentation already exist. The refi defect share plummeted by 32.81% from 16.67% in Q2 to 11.2% in Q3.
Purchase reviews remained the most prevalent in the third quarter, accounting for 89.41% of transactions reviewed. The share of reviews devoted to purchases has steadily increased since Q2 2021, mirroring the overall origination environment, and critical defects in purchases have, unfortunately, kept pace, ramping up from 54% to 89% over the same period. As is often the case, the more closely you examine something, the more likely you are to find something, and that is largely the story with purchase defects. Given the relative parity between review and defect share, there’s not much here that is unexpected.
Defects by Loan Purpose: Q3 2024
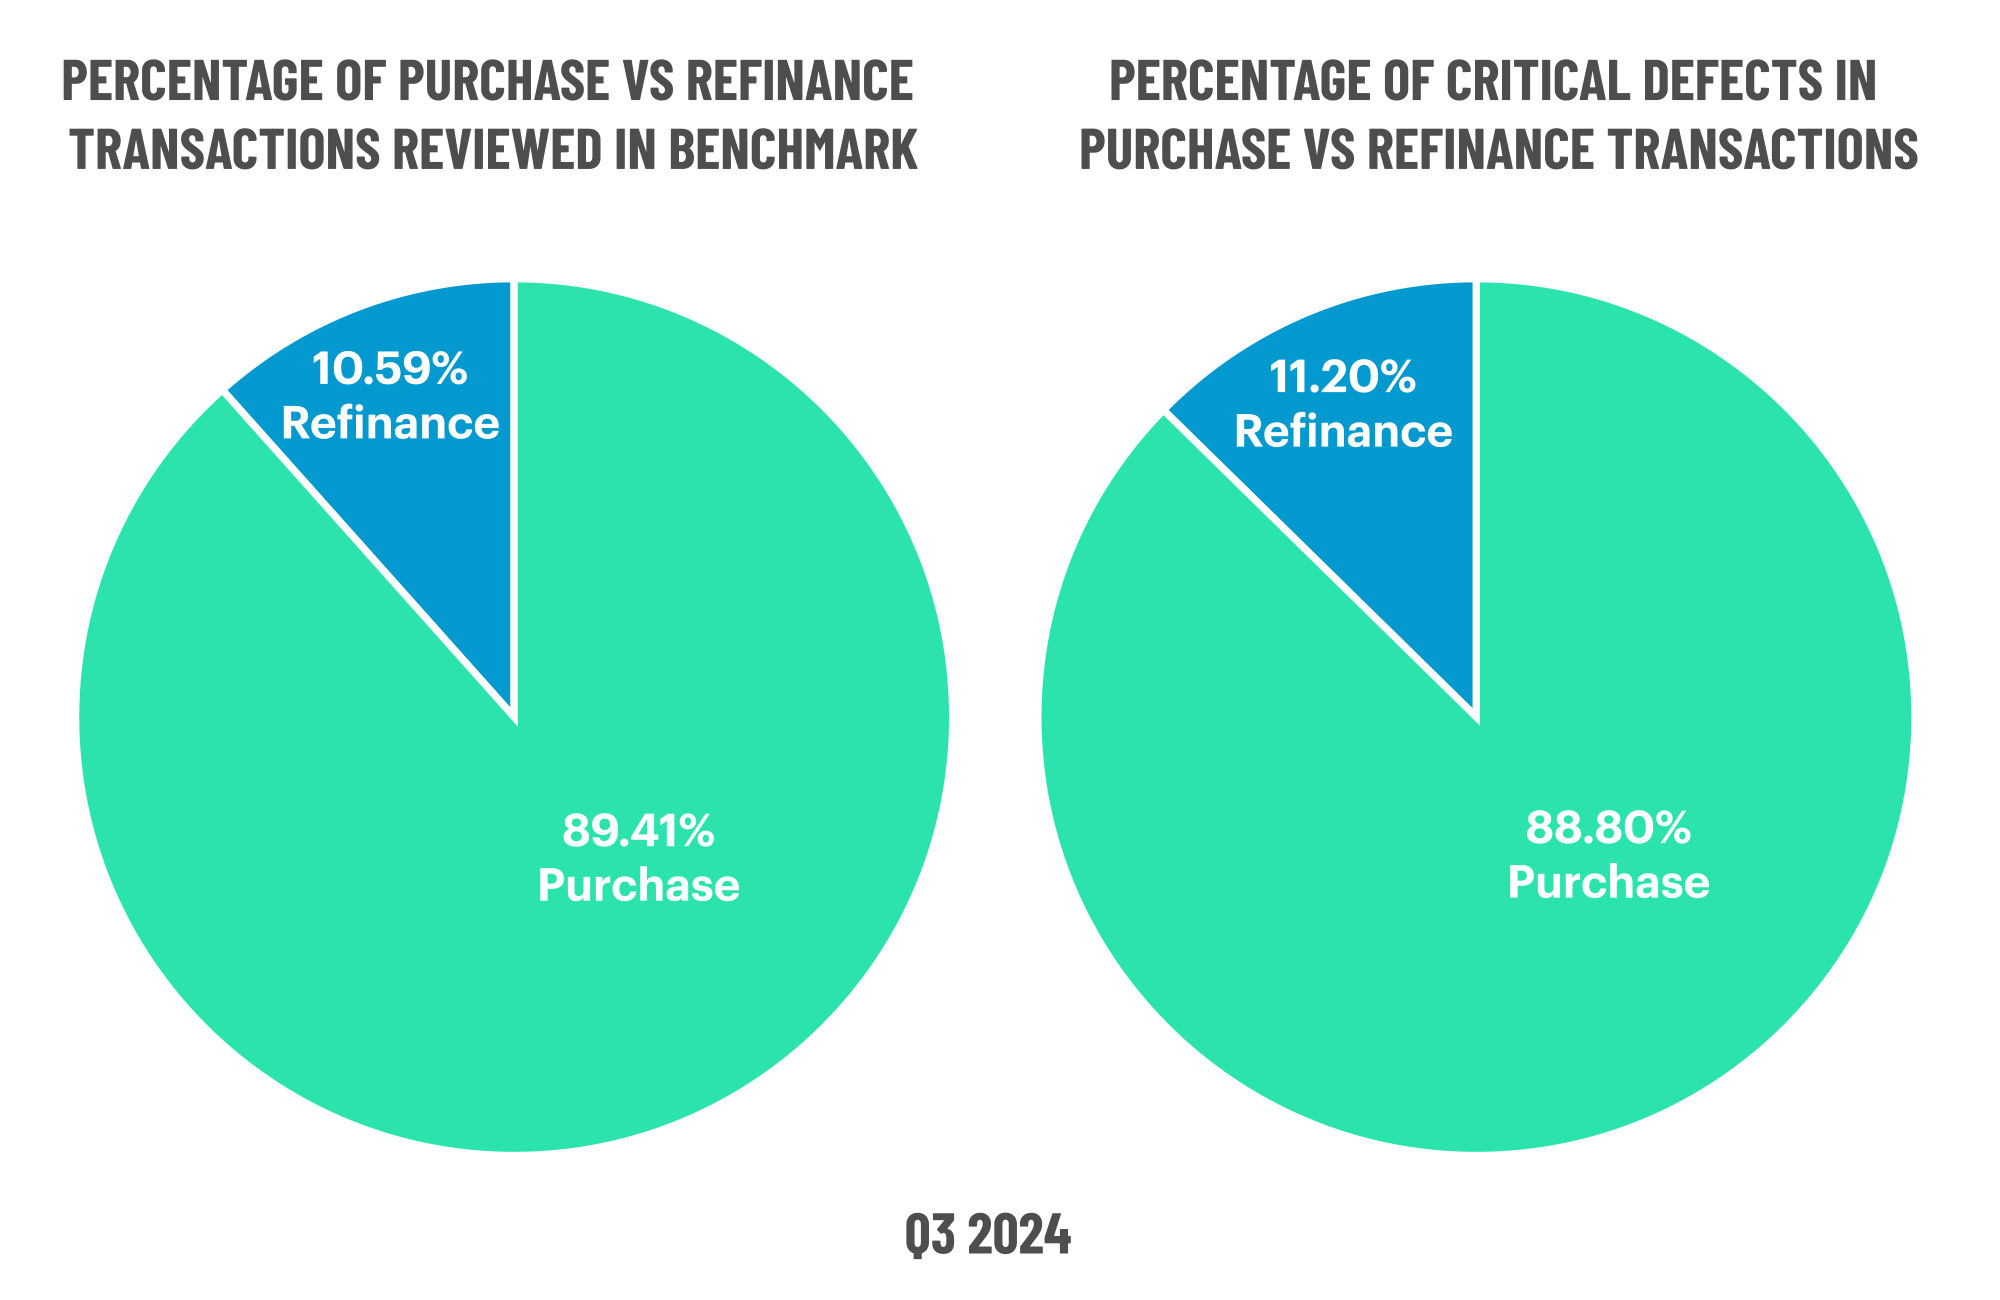
Figure 6 displays the loans reviewed and critical defects by loan purpose for Q3 2024.
QC Trends by Loan Product Type
In a trend reversal from the prior quarter, critical defects in conventional loans dropped sharply from 66.44% in Q2 to 51.61% in Q3. Critical defects in conventional loans had climbed almost eight points from Q1 to Q2 so this shift in the opposite direction is a welcome sight. Review-wise, conventional loans accounted for 63.46% of all reviews in Q3.
While FHA critical defects took a 12-point dive from Q1 to Q2, from 34.91% to 22.6%, performance reversed course in Q3, with defects climbing to 28.23%. Despite the volatility, FHA review share has remained consistently in the 20% range throughout the first three quarters of the year, accounting for 19.13% of reviews this quarter.
Similarly, USDA review share has remained relatively steady despite volatility in defect share. After spiking to 8.9% in Q2, defects decreased to 1.61% in Q3 while review share shifted from 2.03% in Q2 to 1.72% in Q3.
In Q3, the VA endured its highest share of critical defects since at least Q1 2021, jumping from 2% in Q2 to 19% in Q3. Its second-highest defect share happened in Q2 2022, when it reached 18 percent. In the 13 quarters since then, the veterans’ mortgage powerhouse has mostly kept defects below 10%.
This quarter’s VA numbers likely reflect a short-term uptick stemming from discrepancies in the income reverification letter. Because these reviews are classified as post-close QC reviews, they are included in this quarter’s findings. However, a large portion of the defects are from targeted audits to confirm previously identified issues. Thus, the dramatic increase observed this quarter does not reflect a significant degradation in quality.
Freddie Mac repurchases dropped in the third quarter as the GSE changed how it classifies loans with defects that the seller has cured5. This shift may have resulted from backlash regarding Freddie Mac’s aggressive approach to income verification defects, as reported by HousingWire following an analysis of public filings6. FHA’s 7-point climb in defect share, while its review share dipped slightly, is worth mentioning given the agency’s outsized influence on the industry overall.
Defects by Loan Product Type: Q3 2024
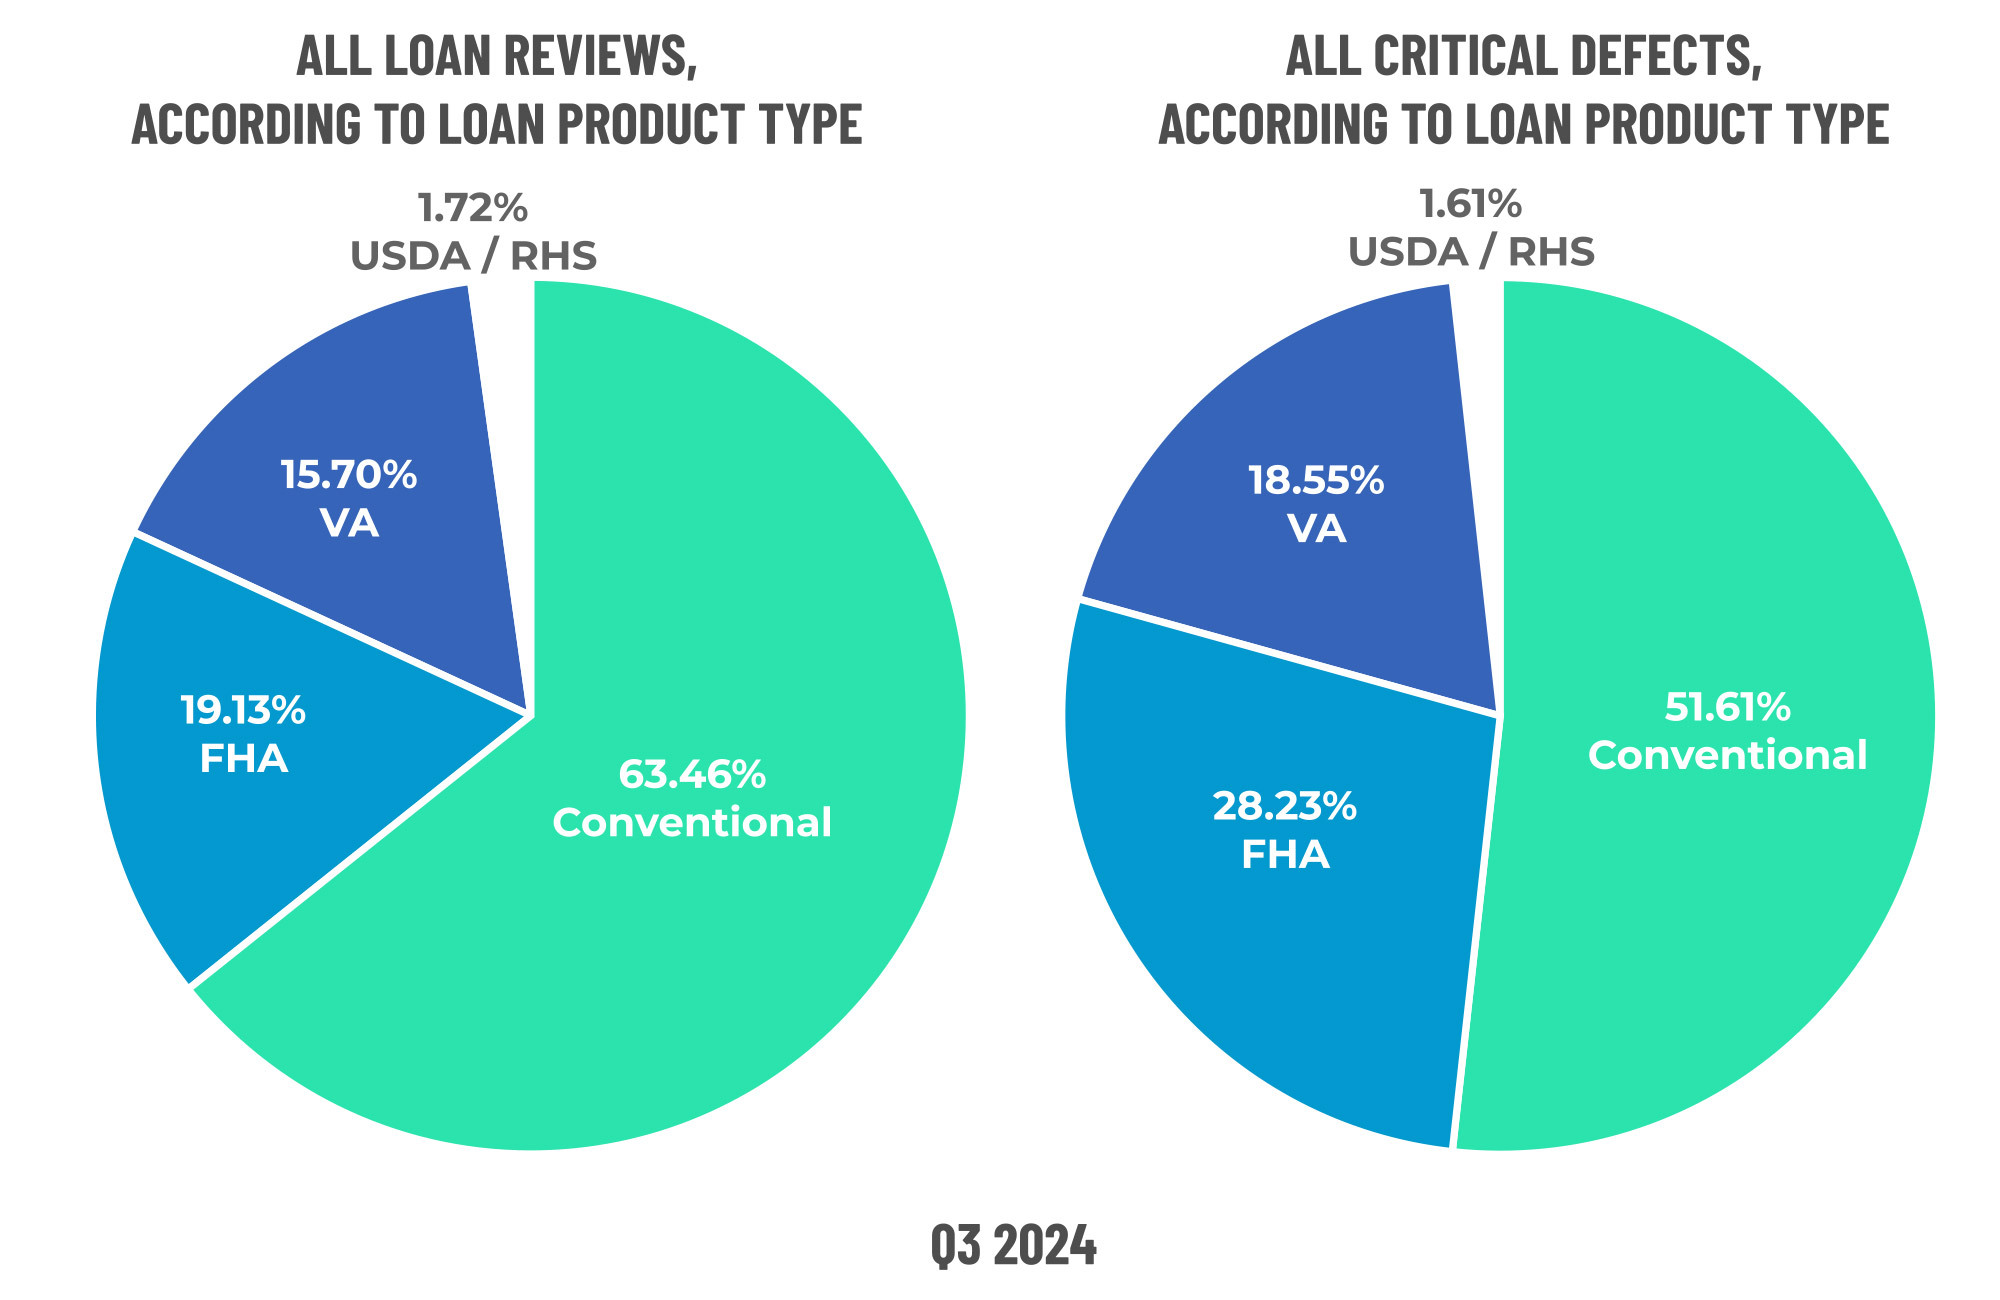
Figure 7 displays the loans reviewed and critical defects by loan type for Q3 2024.
5 https://www.insidemortgagefinance.com/articles/232937-seller-gse-repurchases-decline-sharply-in-3q24?v=preview
6 https://www.housingwire.com/articles/loan-buybacks-freddie-mac-raising-eyebrows/
Economic Discussion
With 2024’s natural disaster price tag likely exceeding that of 2023 as wildfires in California destroyed miles of million-dollar residences, insurance issues will not be going away any time soon. Meeting the standard for a home loan purchase or refinance relies upon meeting the standard for home insurance but, as this report has noted, premiums have increased dramatically in some regions, inflating borrower debt so much that the standard measure of debt-to-income ratio becomes untenable for would-be homeowners. They simply cannot qualify for the mortgage they would have swanned into a few years ago. Instead, state-sponsored insurance plans or “forced placed” insurance comes into play.
In June 2024, the Bipartisan Policy Center (BPC) noted the specific factors that affect insurer costs relative to natural disasters:
- Rising home prices, inflation, and the increasing cost to rebuild housing;
- Higher expenses due to fraud and changes in societal expectations and legal practices that have made litigation more common and more costly; and
- A sharp rise in the cost of reinsurance—insurance purchased by insurance companies to reduce and manage risk—due in part to the very high expenses of catastrophic disasters7.
The BPC warned that many homes in areas with severe climate risks and soaring insurance costs may be “approaching a tipping point, where they could become difficult to sell and plummet in price, slashing the net worth of existing homeowners.” A poll commissioned by BPC and the National Housing Conference found that “approximately 40% of homeowners surveyed reported experiencing either an increase in the cost of their homeowners insurance or difficulty securing coverage in the past year.”
As noted earlier in this report, the rising cost of homeowners insurance across the board and the lack of coverage in disaster-prone areas have made buying a home in the current market that much more difficult, and those difficulties are now impacting loan quality. This phenomenon is not unlike how affordability challenges have triggered a rise in defects in the major underwriting categories. In the long term, however, insurers’ actions could have a much more significant and profound effect on the housing market as a whole.
While homes located in areas at high risk for heat, fire and flood are still more valuable now than they were prior to the pandemic, 2024 marked the first year that appreciation for homes located in low-risk areas outpaced that of homes in high-risk areas8. What’s more, states like California, Texas and Florida that typically rank in the top three for the largest share of mortgage originations in the U.S. are also among the top high-risk areas for insurers. While data on how insurance challenges are impacting originations in these states is mainly anecdotal, it would not be surprising to see purchase volume shift from a geographic perspective to low-risk areas with better affordability.
7 https://bipartisanpolicy.org/blog/rising-insurance-costs-and-the-impact-on-housing-affordability/
8 https://www.redfin.com/news/home-values-climate-risk-2024/
Conclusion
The Q3 2024 ACES QC Industry Trends Report highlights a notable shift in quality control dynamics, with the overall critical defect rate declining for the first time in four quarters. However, significant volatility in key underwriting categories underscores the need for heightened vigilance. The resurgence of insurance-related defects, combined with increased asset and credit documentation issues, suggests lenders must refine their QC strategies to address emerging risks.
While refinances saw improved loan quality, purchase transactions—comprising nearly 90% of reviews—continued to experience elevated defect rates. VA loan defects spiked in Q3, though this appears to be a temporary anomaly. As the industry navigates fluctuating interest rates and evolving risk factors, lenders should leverage data-driven insights and proactive QC measures to maintain loan quality and mitigate future challenges.
About the ACES Mortgage QC Industry Trends Report
The ACES Mortgage QC Industry Trends Report represents a nationwide post-closing quality control analysis using data and findings derived from mortgage lenders utilizing the ACES Analytics benchmarking software.
This report provides an in-depth analysis of residential mortgage critical defects as reported during post-closing quality control audits. Data presented comprises net critical defects and is categorized in accordance with the Fannie Mae loan defect taxonomy.
About ACES
ACES Quality Management is the leading provider of enterprise quality management and control software for the financial services industry. The nation’s most prominent lenders, servicers and financial institutions rely on ACES Quality Management & Control® Software to improve audit throughput and quality while controlling costs, including:
- 70% of the top 20 independent mortgage lenders;
- 7 of the top 10 loan servicers;
- 11 of the top 30 banks; and
- 3 of the top 5 credit unions in the United States.
Unlike other quality control platforms, only ACES delivers Flexible Audit Technology, which gives independent mortgage lenders and financial institutions the ability to easily manage and customize ACES to meet their business needs without having to rely on IT or other outside resources. Using a customer-centric approach, ACES clients get responsive support and access to our experts to maximize their investment.
For more information, visit www.acesquality.com or call 1-800-858-1598.
Media Contact: Lindsey Neal | DepthPR for ACES | (404) 549-9282 | lindsey@depthpr.com
View all reports