ARMCO’s Mortgage QC Industry Trends Report represents an analysis of nationwide quality control findings based on data derived from the ACES Analytics benchmarking software.
Executive Summary
QC Industry Trends – Overview
QC Industry Trends – by Category
QC Industry Trends – by Loan Purpose
QC Industry Trends – by Loan Type
Conclusion
About this Report
Executive Summary
This report represents an analysis of post-closing quality control data derived from loan files ana- lyzed by the ACES Analytics benchmarking system during the fourth quarter of 2018 (Q4 2018) along with calendar year (CY) data for 2017 and 2018.
Findings for the Q4 2018 Trends Report were based on post-closing quality control data from over 90,000 unique loans. All reviews and defect data that were evaluated for this report were based on loan audits selected by lenders for full file reviews.
Defects are categorized using the Fannie Mae loan defect taxonomy. Data for any given calendar quarter is analyzed no earlier than 90 days after the end of the quarter to allow sufficient time for lenders to complete the post-closing quality control cycle. Hence, ARMCO releases analyses for Q4 2018 in or soon after Q2 2019.
NOTE: A critical defect is defined as a defect that would result in the loan being uninsurable or ineligible for sale. The critical defect rate reflects the percentage of loans reviewed for which at least one critical defect was identified during the post-closing quality control review and all reported defects are net defects.
Summary of Findings
In Q4 2018, the leading critical defect categories were (1) Income and Employment, (2) Credit and (3) Loan Package Documentation. In CY 2018, purchase transactions continued to outpace refinances, comprising 72.09% of all transactions reviewed.
Report highlights include the following findings:
- In Q4 2018, the critical defect rate increased just over 2%, reaching 1.93% from the previous quarter’s rate of 1.89%.
- In CY 2018, the critical defect rate increased almost 8% over the previous year, jumping from 1.68% in CY 2017 to 1.81% in CY 2018.
- Defects related to Income and Employment are on the rise:
- In Q4 2018, Income and Employment related defects increased 63% over Q3 2018
- In Q4 2018, Income and Employment related defects comprised a greater percentage of total defects for both CY 2018 and CY 2017.
- Defects attributed to Loan Package Documentation more than doubled between CY 2017 and CY 2018.
- In Q4 2018, the top three categories that increased over Q3 2018 were all key qualification categories: Income and Employment, representing 20.39% of all critical defects in the benchmark. This category was followed by Credit at 18.45% and Loan Package Documentation at 15.53%.
- In CY 2018, FHA loans accounted for roughly 31% of the loans reviewed but represented approximately 41% of loans containing critical defects.
QC Industry Trends – Overview
While we are not yet ready to sound the alarm, ARMCO’s data shows that critical defect rates are rising and at the highest we have observed in more than three years. One could even argue that defect rates in Q4 2018 are higher than at any point since the Great Recession and corresponding credit crisis of 2008 – since the other high (Q1 2016 – 1.92%) was largely temporary and highly correlated to the introduction of the TILA-RESPA Disclosure (“TRID”) rule. When looking at trends in critical defect rates, ARMCO watches both the change in rate from recent quarters as well as the change as compared to the same quarter in the prior year. The final critical defect rate for Q4 2018 was 1.89%, creeping up 2% from Q3 2018 and a more dramatic rise of almost 8% from Q4 2017.
The critical defect increased steadily throughout 2018, starting at 1.72% at the end of Q1 2018 and ending the year at 1.93%. No doubt that the overall mortgage lending environment contributed to the upward trend, as discussed below. Various different aggregators of mortgage rate data put the average rate on a 30-year fixed rate mortgage at 3.95% to start 2018, peaking at 4.94% and ending the year at 4.55%. What ARMCO will be watching going forward is whether or not interest rates continue to move higher (they are not, so far in 2019) and what effect that will have on overall loan quality.
Lending Environment Commentary:
• Highly qualified borrowers largely sit out the market when interest rates are increasing – having locked in low mortgage rates when rates were lower.
• As a result, marginal borrowers are more prevalent, and lenders trying to maintain or grow lending volumes stretch to qualify every borrower.
• From a quality perspective, in an increasing rate environment, loans with typically lower defect rates (rate/term refis, FHA Streamlines, and VA IRRRLs) make up a significantly lower portion of loans originated in this environment.
• While the rate of increase is slowing, most areas still saw increasing property values – which also raises the mortgage qualification bar higher.
Figure 1 displays critical defect rates—the number of loans containing at least one critical defect as a percentage of the total closed loans reviewed—for the past four calendar quarters. All loans reviewed are part of a lenders’ monthly random post-closing quality control review.
Critical Defect Rate by Quarter: Q4 2018
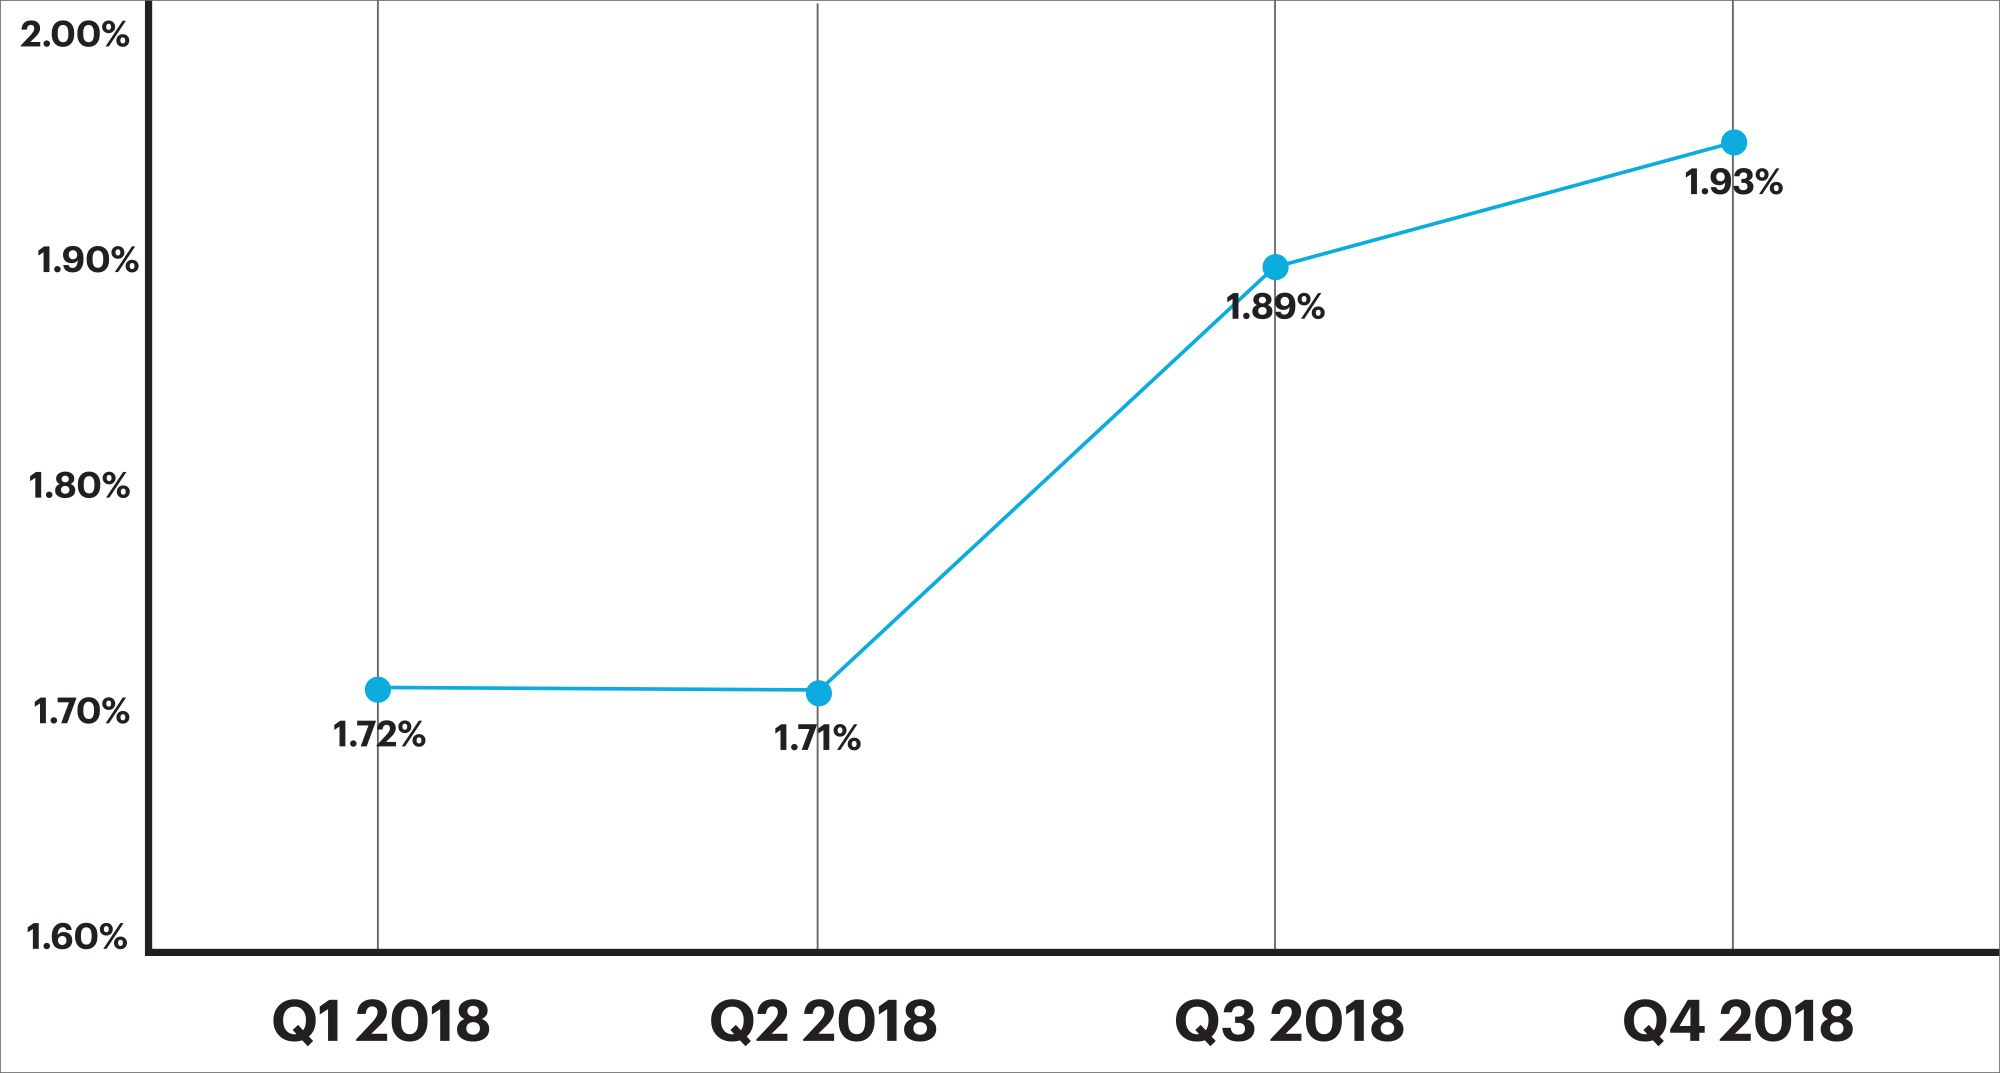
Figure 1: Percentage of loans with critical defects by quarter, Q1 2018 through Q4 2018
Figure 2 displays critical defect rates—the number of loans containing at least one critical defect as a percentage of the total closed loans reviewed—for CY 2018 vs. CY 2017. All loans reviewed are part of a lenders’ monthly random post-closing quality control review.
Critical Defect Rate by Year: CY 2017 vs CY 2018
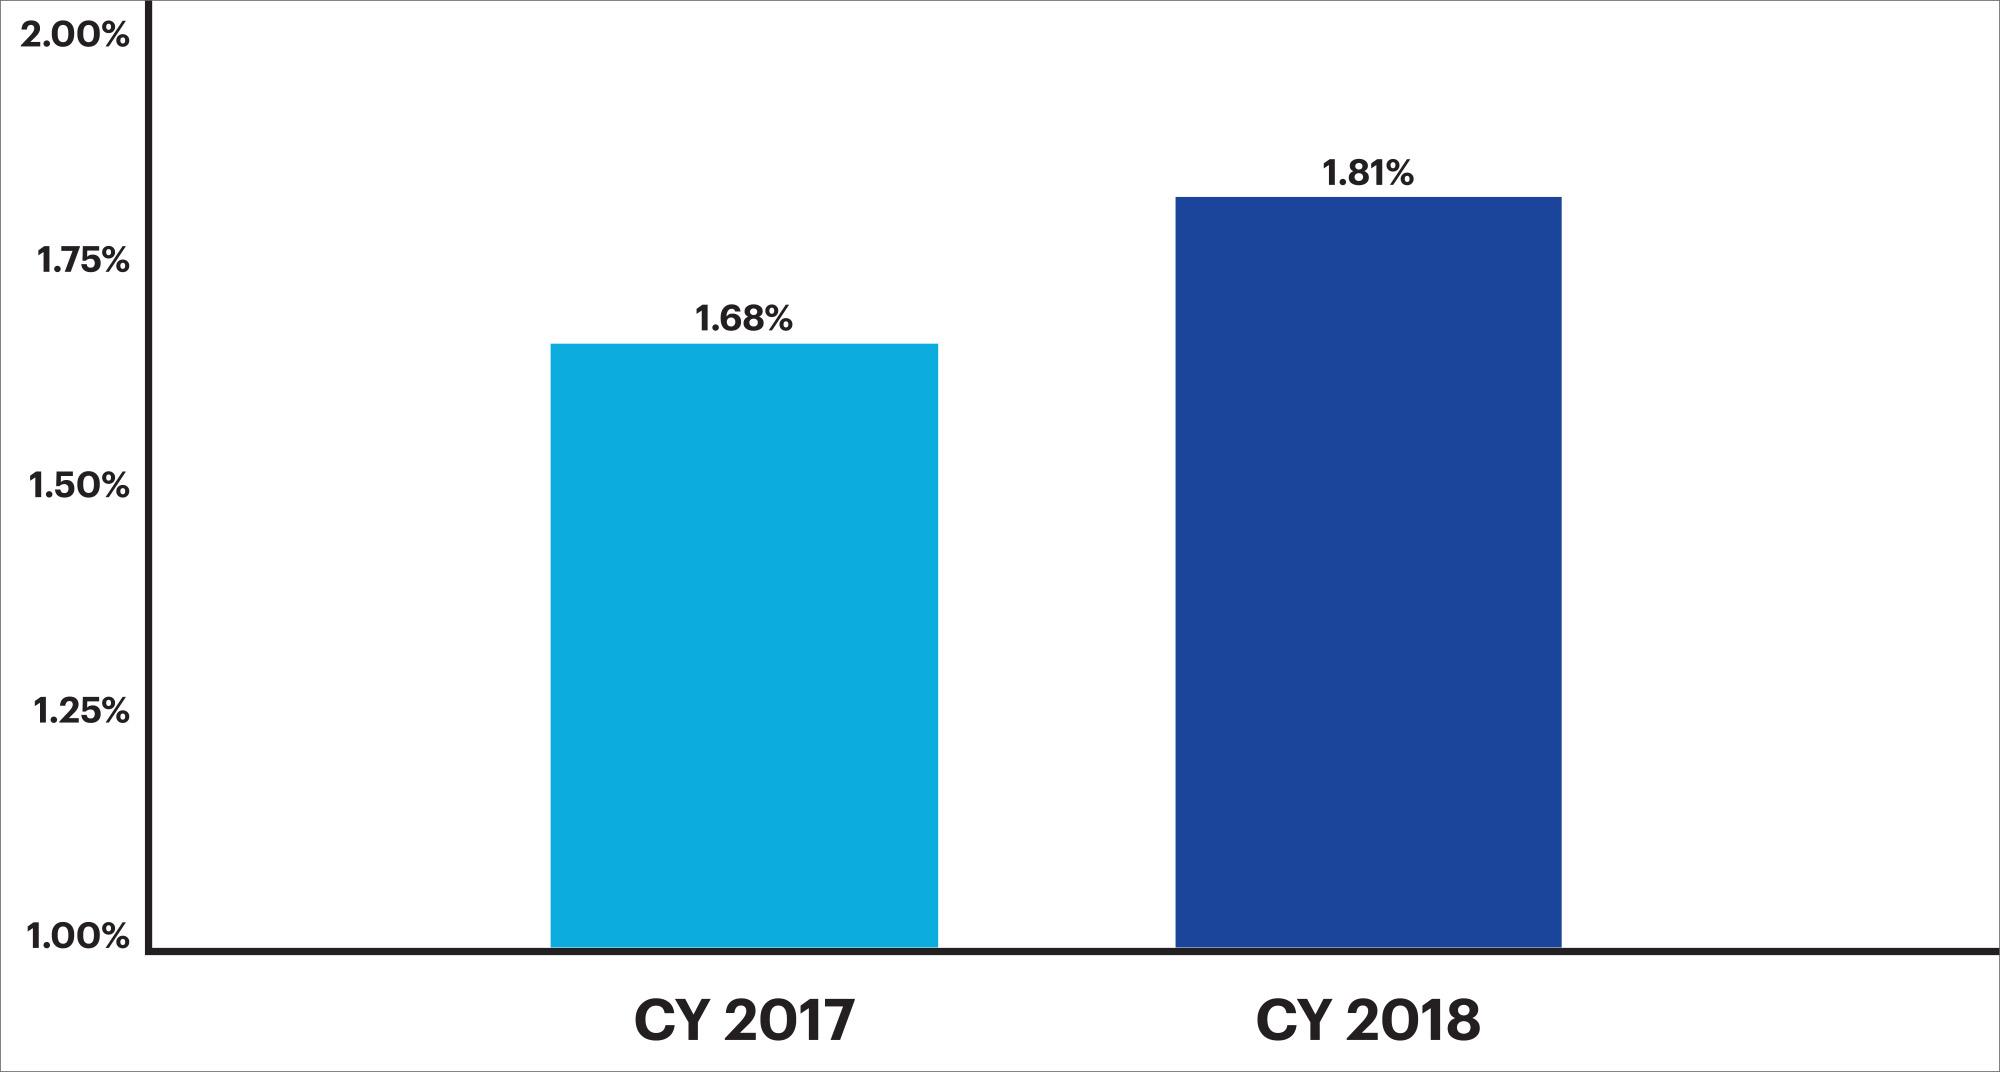
Figure 2: Critical Defect Rate by Year: CY 2017 vs CY 2018
QC Industry Trends by Defect Category
The distribution of critical defects and activity within specific defect categories can reveal a lot about the state of the market.
In Q4 2018, Income and Employment related defects occurred the most frequently of all defect categories, comprising 20.39% of all critical defects. This represents a gain of 7.89 points and a 63% increase over the Q3 2018’s rate of 12.50%. This category exceeded the rate of CY 2018 (20.14%) and CY 2017 (17.00%). Regardless of how one views the numbers, defects related to Income and Employment are on an upward trend.
In Q4 2018, there were five categories that increased over Q3 2018—and all five are key qualification categories. Defects attributed to Income and Employment accounted for more defects than any other defect category, representing 20.39% of all critical defects in the benchmark. This category was followed by Credit at 18.45%, Loan Package Documentation at 15.53%, Borrower Eligibility at 13.59% and Assets at 12.62%. Each of these categories also comprised a greater percentage of total loans when compared to the previous calendar year (CY 2017).
Several categories showed a decline from Q3 2018. Regulatory Compliance, Appraisal and Property/Eligibility-related defects had been on the decline prior to the previous quarter (Q3 2018), and this trend continued in Q4 2018. However, Loan Package Documentation, which did decline from Q3 2018, actually increased year over year, with defect rates more than doubling from CY 2017 (9.8% of all critical defects) to CY 2018 (18.90% of all critical defects).
The spike in defects related to key qualification categories likely results from the overall climate of the housing and mortgage lending environment. With the combination of market's increasing interest rates and the continued escalation in property values in most areas, mortgage qualification has become more challenging. As a result, many applicants who may have previously been rated as highly qualified borrowers, are now rated as marginal qualifiers. Marginal borrowers are harder to qualify and thus typically require more supporting documentation for the credit decision. This increase in supporting documentation has in turn increased the likelihood that a Loan Package Documentation exception will occur.
Figure 3 compares the percentage of defects in each category for Q4 2018 vs. Q3 2018.
Critical Defects by Fannie Mae Category: Q3 2018 vs Q4 2018
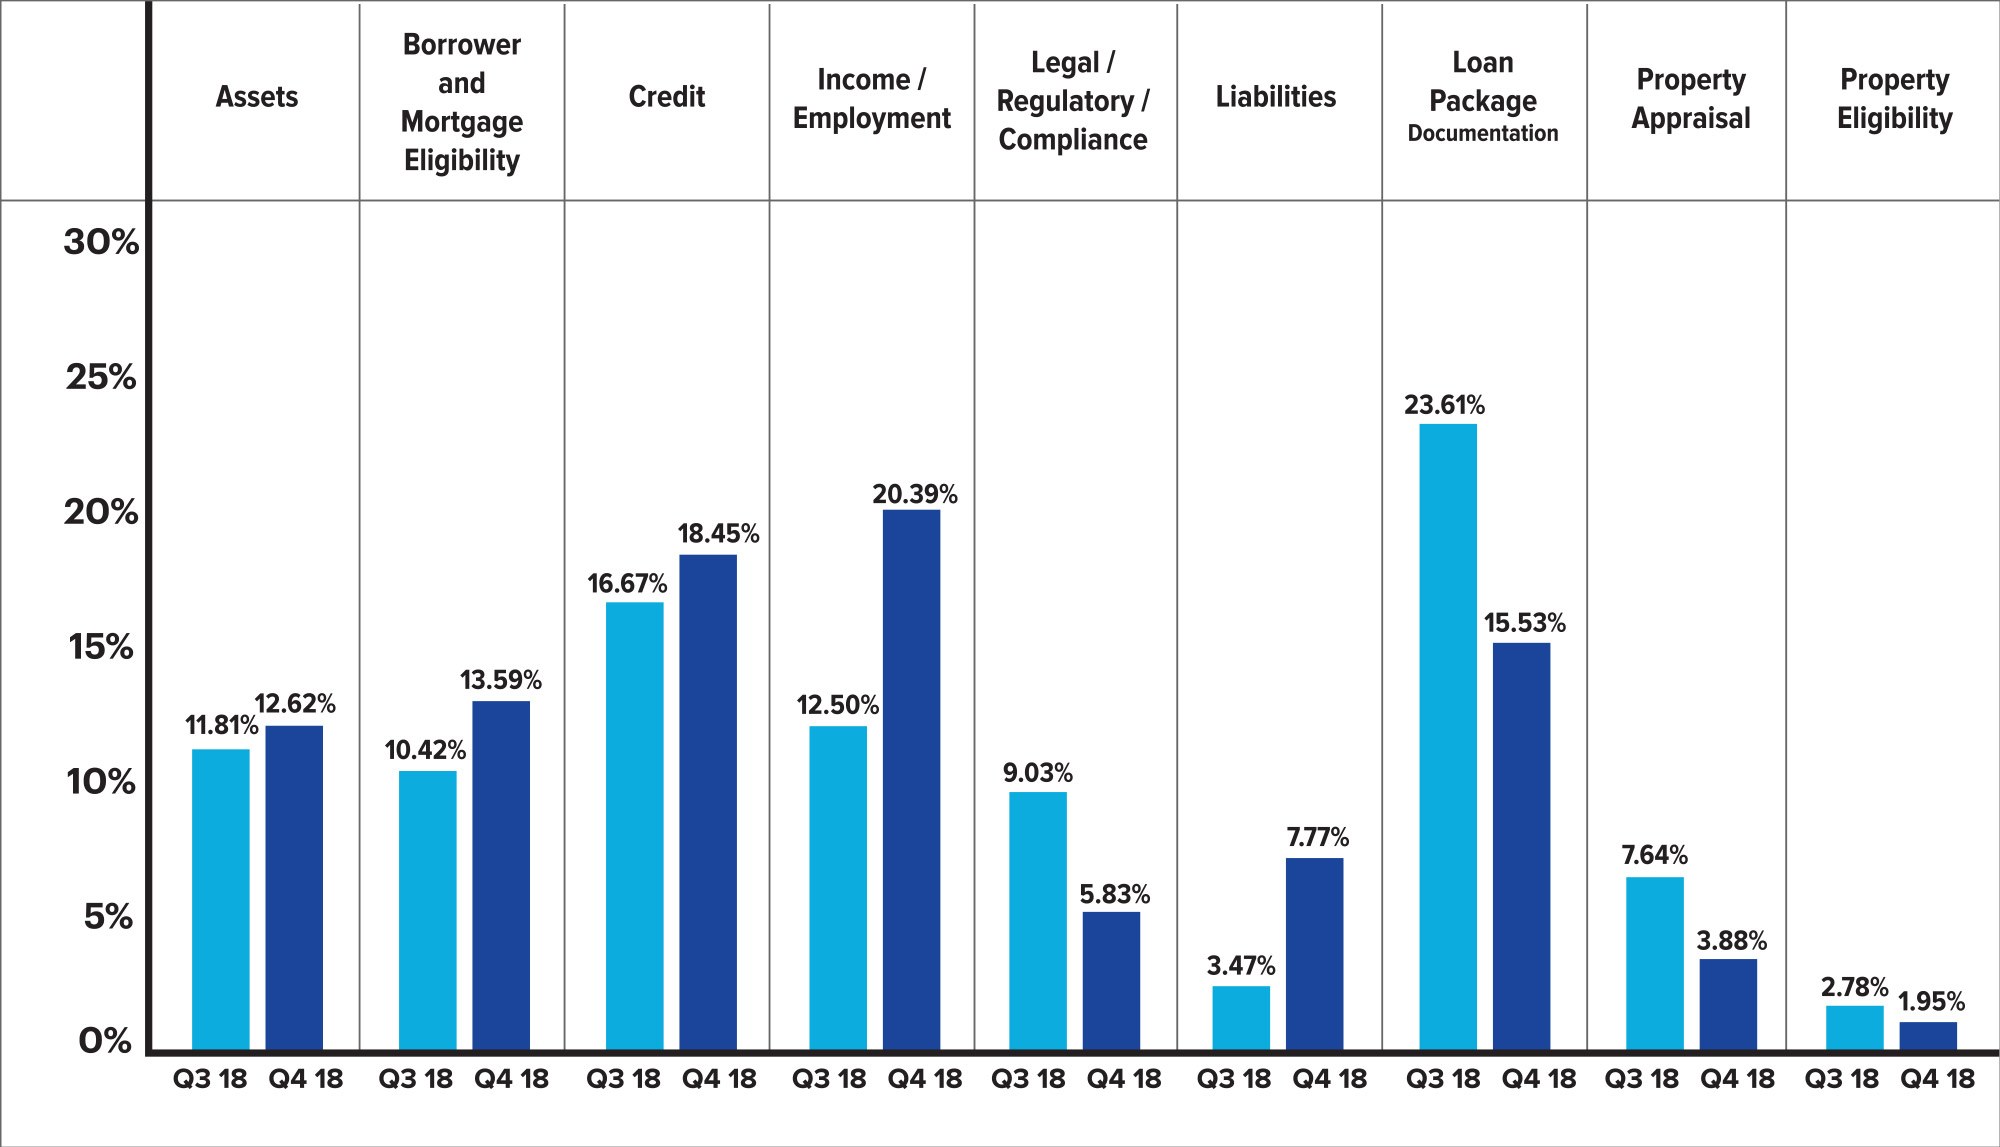
Figure 3: Q3 vs Q4 2018 net critical defects according to Fannie Mae defect category
Figure 4 shows net critical defects sorted according to Fannie Mae defect category, for Q4 2018 versus CY 2018.
Critical Defects by Fannie Mae Category: Q4 2018 vs. CY 2018
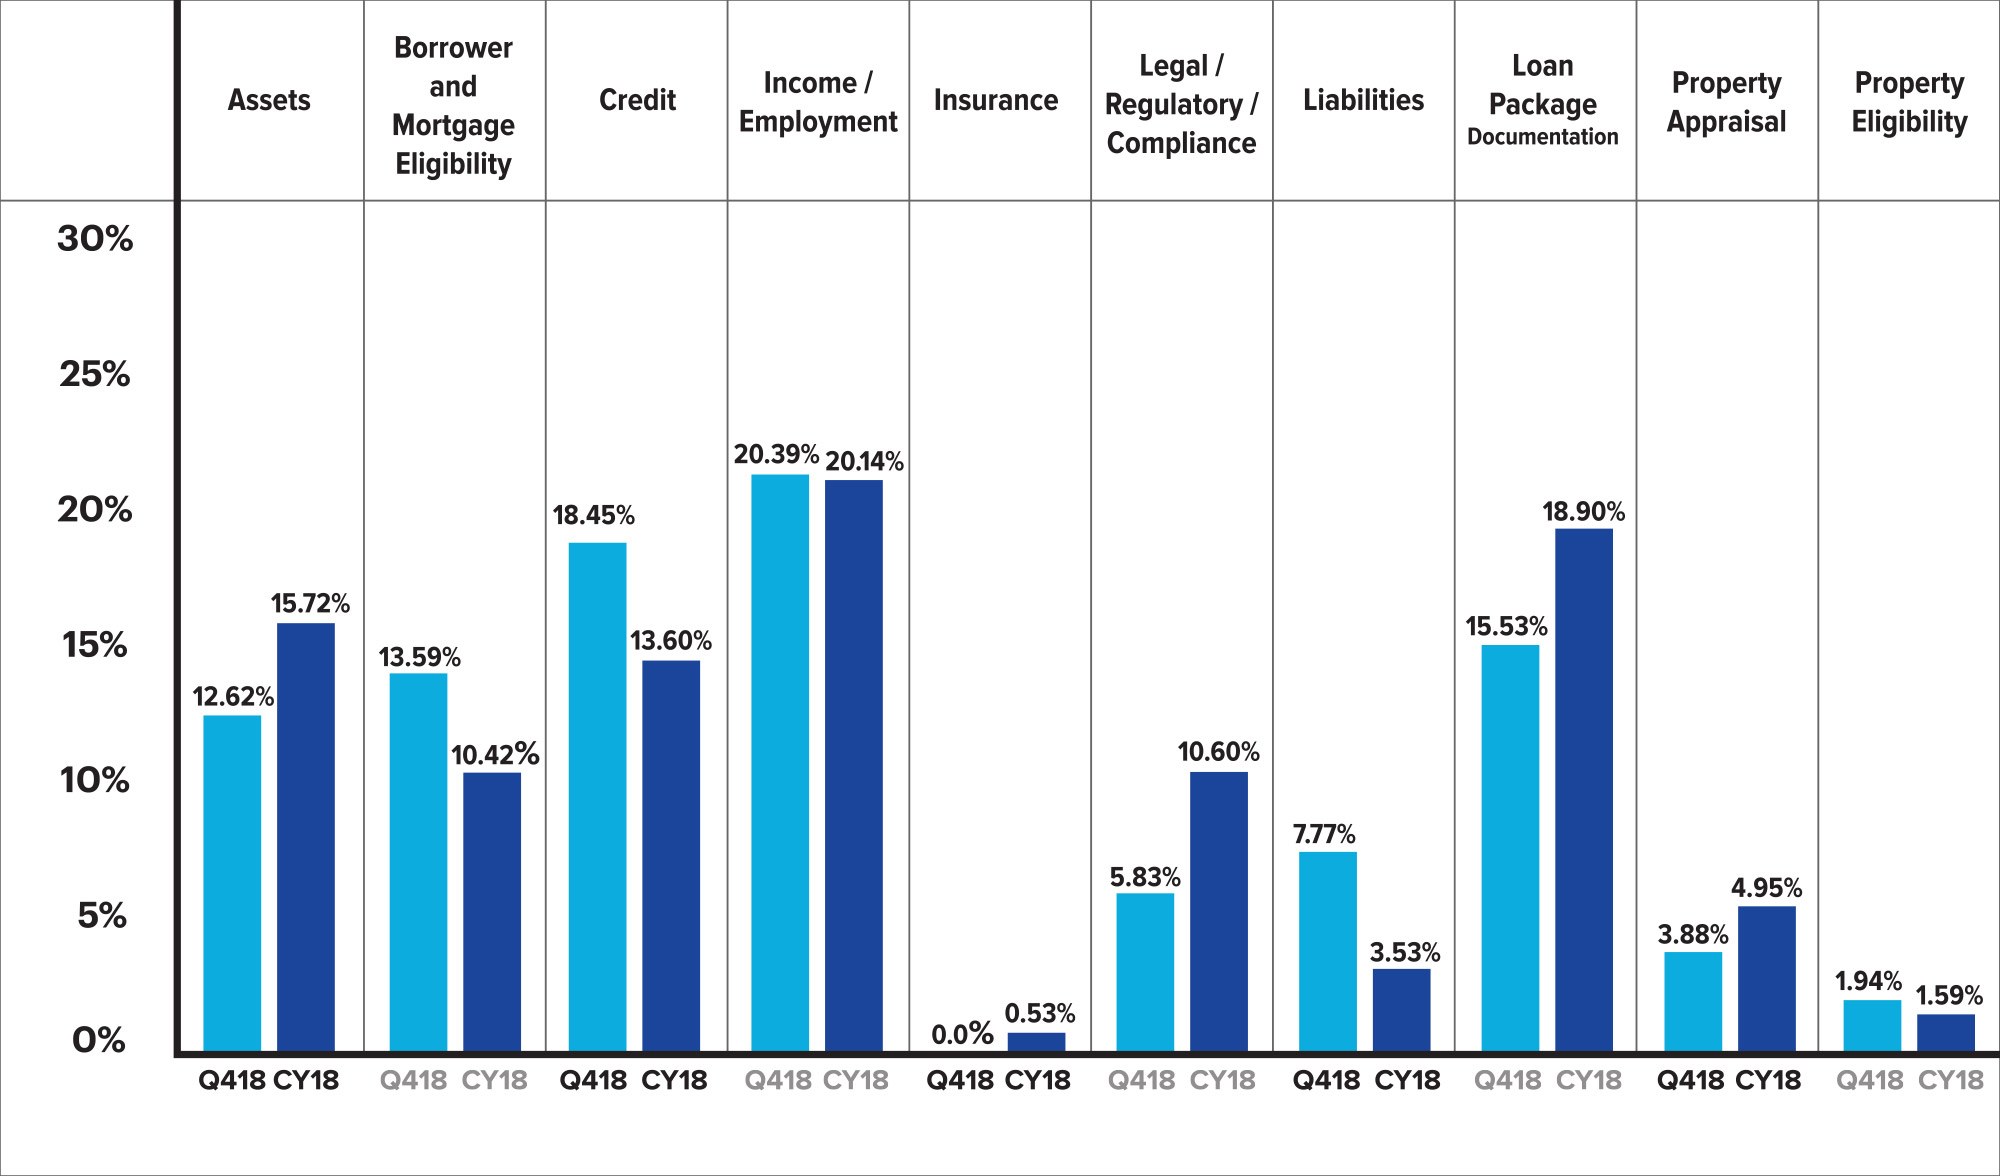
Figure 4: Q4 2018 vs. CY 2018 net critical defects according to Fannie Mae defect category
QC Industry Trends by Loan Purpose
In CY 2018, interest rates remained higher than in prior years. These higher rates fueled the continuation of a purchase-driven market with lower loan origination volume overall. In CY 2018 purchase transactions comprised 72.09% of all loans reviewed, approximately 12% more than in CY 2017, when purchase transactions accounted for 64.14% of all reviewed loans.
Overall quality for purchase transactions improved significantly from CY 2017 to CY 2018. In CY 2018, purchase transactions represented 72.09% of all reviewed loans, and accounted for 76.16% of all reported critical defects, a differential of roughly 5%. In contrast, in CY 2017 however, purchase transactions represented 64.14% of all reviewed loans, but accounted for over 71.43% of all reported critical defects, a differential of over 11%—more than twice that of CY 2018.
This marked improvement can be attributed to more lenders leveraging QC technology and improving their processes to better address the continued challenges of a purchase dominated market.
Figure 5 providesa comparison of all reviewed loans by loan purpose and all critical defects by loan purpose for CY 2017 and CY 2018.
Loans Reviewed vs. Critical Defects by Loan Purpose: CY 2017 vs. CY 2018
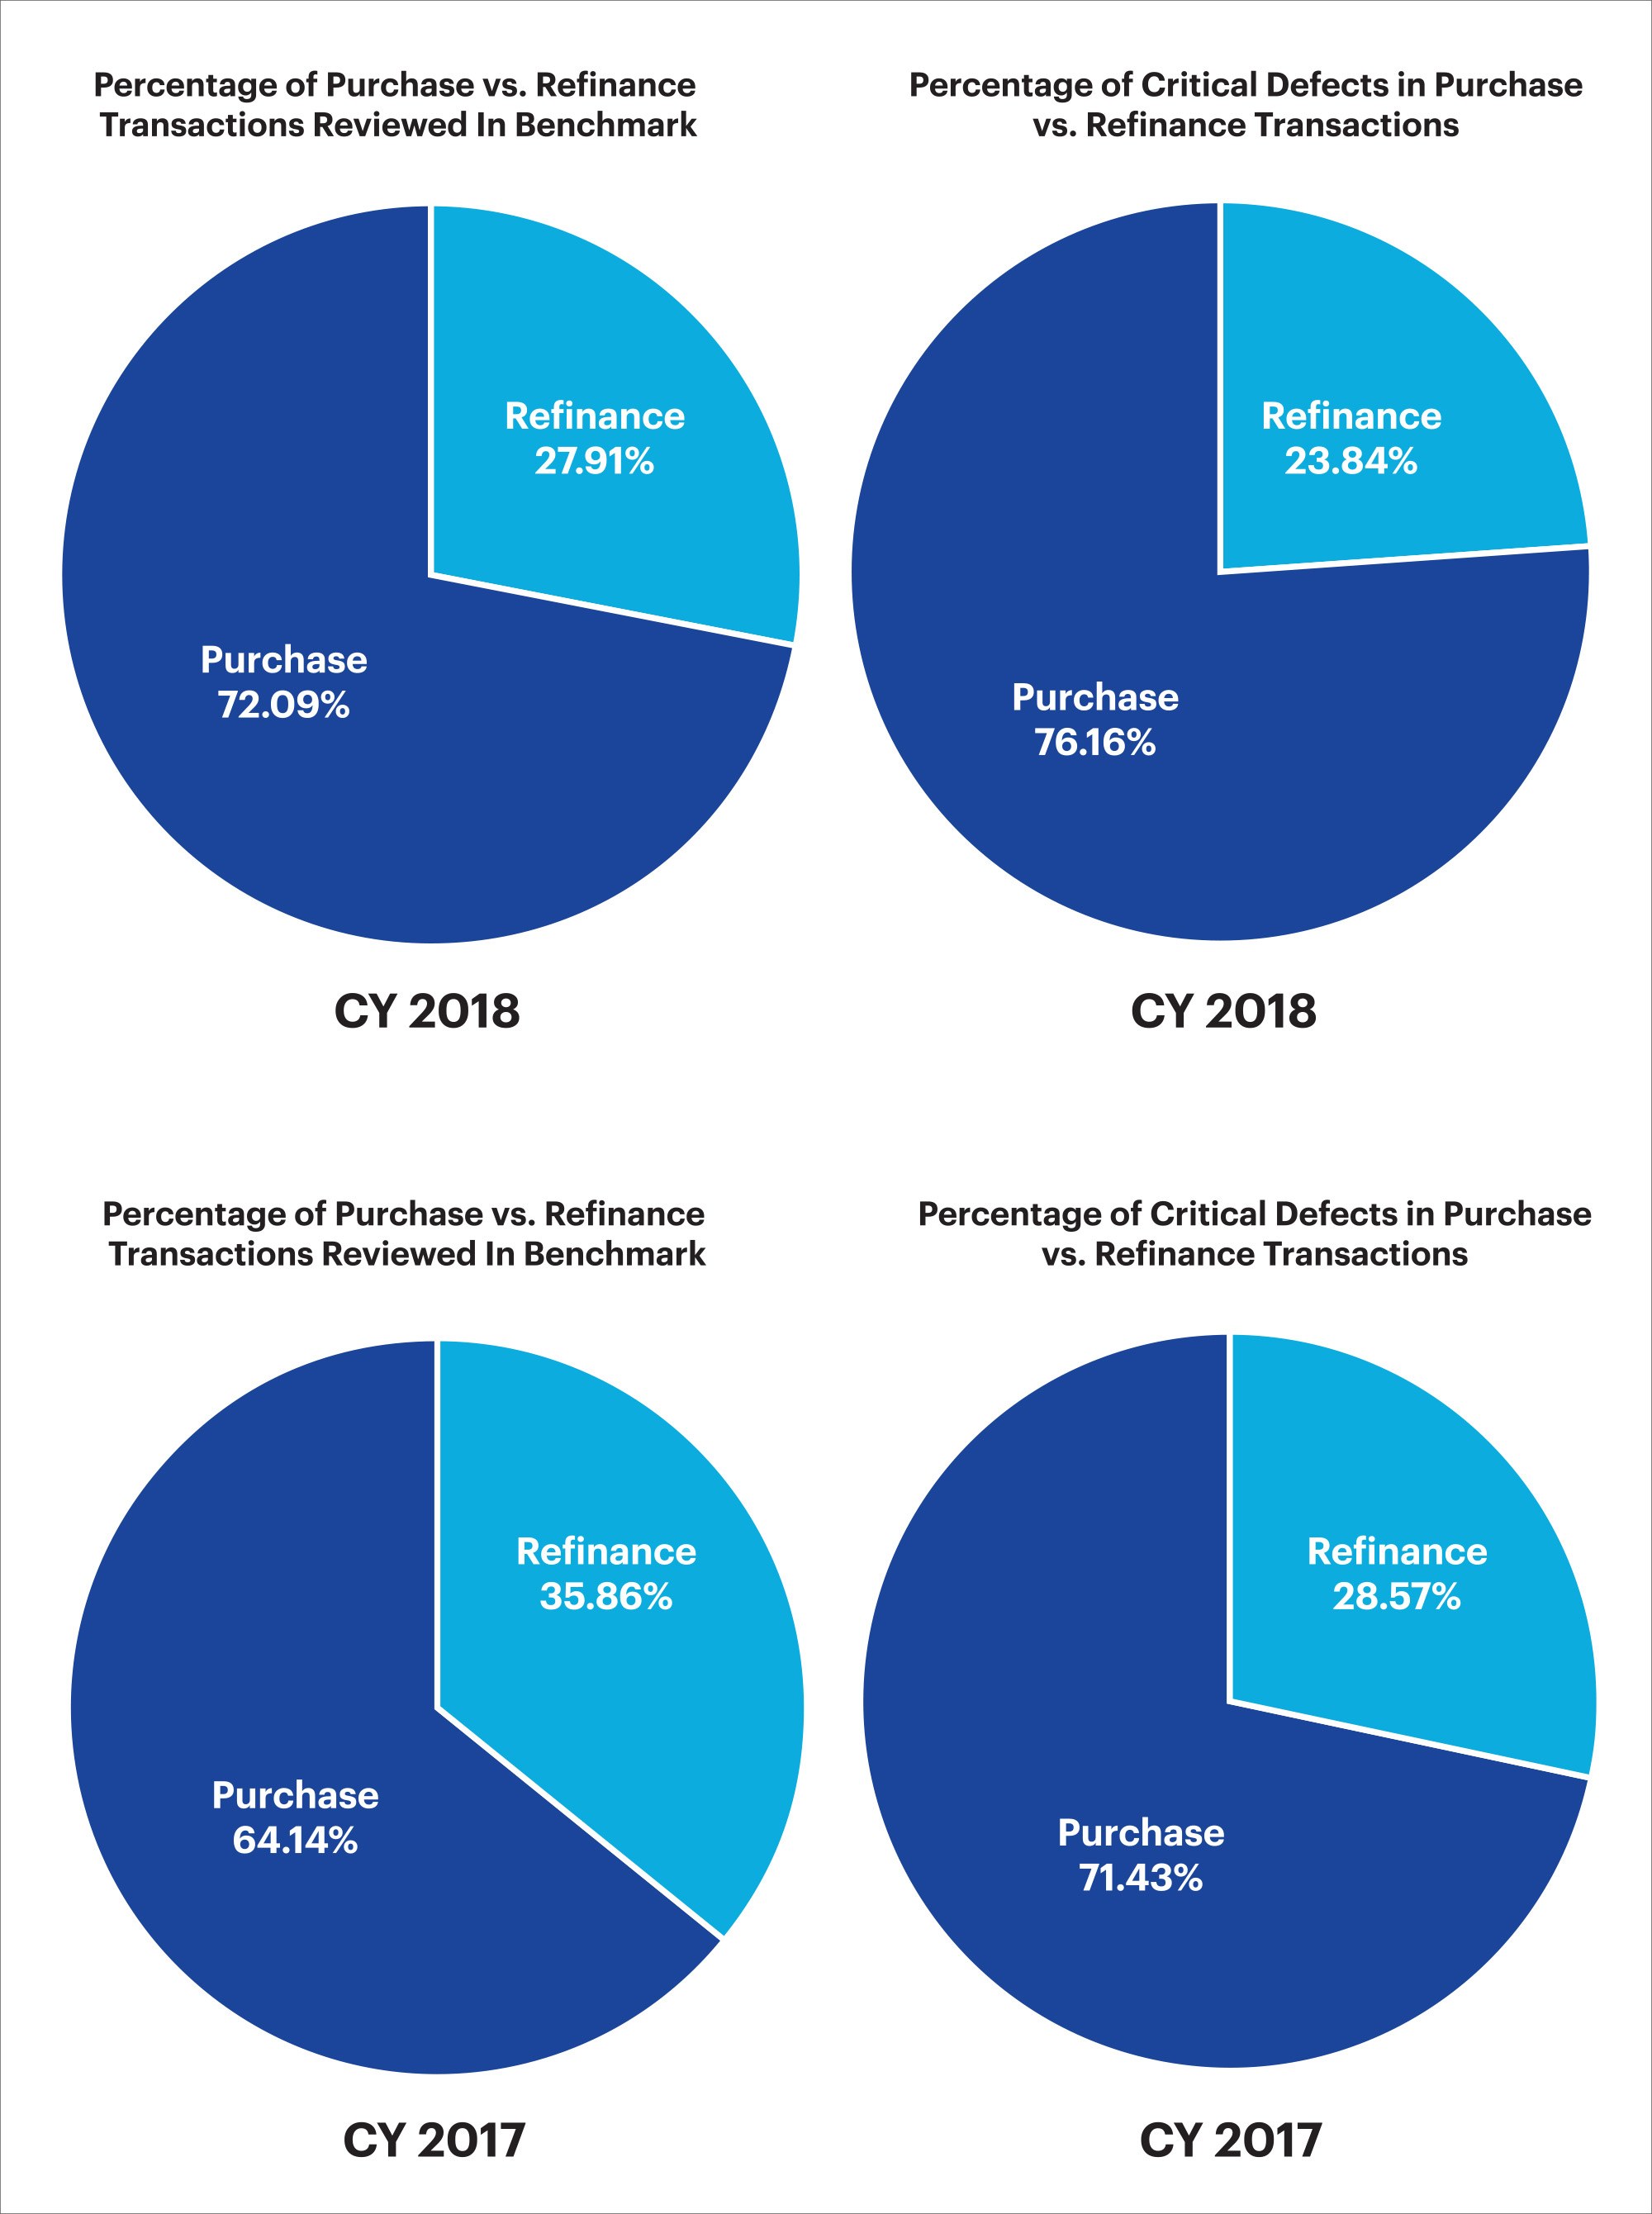
Figure 5: CY 2017 vs. CY 2018 critical defects by loan purpose.
QC Industry Trends by Loan Type
In CY 2018, the distribution of critical defects among the various loan types originated continued a pattern similar to that of the previous calendar year: the percentage of critical defects did not directly correlate to the distribution of loans reviewed.
The greatest differential occurred with FHA loans, where defect rates are typically higher than other loan types. In CY 2018, FHA loans represented 31.07% of all loans in the benchmark and 40.70% of all critical defects, similar to CY 2017 (27.16% and 39.57% respectively). While FHA critical defects outpace other loan types, the percentage change quarter-over-quarter and year-over-year remains fairly consistent.
Critical defect rates for Conventional loans remained low, but it should be noted that they saw an increase in the percentage of defects, rising from 46.00% in CY 2017 to 49.28% in CY 2018.
Figure 6 provides a comparison between loan types as a percentage of the benchmark and loan type as a percentage of critical defects (conventional, FHA, VA and USDA).
Critical Defects as a Percentage of All Loan Types: CY 2017 vs. CY 2018

Figure 6: CY 2018 and CY 2017 Loans reviewed and critical defects by loan type
Conclusion
In Q4 2018, the continued escalation of interest rates and home prices in the majority of metropolitan areas resulted in more challenging qualification requirements, and ultimately fewer top qualifying borrowers. This in turn led to lower overall production, decreased volume among lenders, and higher defect rates in areas that are key to mortgage qualification. Many lenders consolidated their labor pools in response to lower volume and some mortgage companies were forced to close their businesses. This trend was consistent throughout 2018.
High interest rates also resulted in fewer refinance transactions, creating a purchase dominant market, which typically presents greater risk, as purchases require more documentation than refinances and more parties are involved in the transaction. Both of these factors increase the chances of error and oversights, while creating a greater opportunity for fraud.
The purchase dominant market and greater challenges in borrower qualification demonstrated their impact on loan quality as critical defects in CY 2018 weighed more heavily in categories related to mortgage underwriting and eligibility.
As the market fluctuates, so do the distribution and frequency of defects. Lenders that want to adapt quickly by not only catching these defects, but also proactively preventing them, will benefit exponentially from analytics tools. Analytical tools can identify the core issues causing defects so that lenders may develop strategies that support their business objectives and proactively protect their profits.
About the ARMCO Mortgage QC Industry Trends Report
The ARMCO Mortgage QC Industry Trends Report represents a nationwide post-closing quality control analysis using data and findings derived from mortgage lenders utilizing the ACES Analytics benchmarking software.
This report provides an in-depth analysis of residential mortgage critical defects as reported during post-closing quality control audits. Data presented comprises net critical defects and is categorized in accordance with the Fannie Mae loan defect taxonomy.
About ARMCO
Over half of the Top 20 mortgage lenders in the U.S. choose ARMCO as their provider of risk management software. ARMCO’s product line includes loan quality enterprise software, services, data and analytics. Its flagship product, ACES Flexible Audit Technology®, has set the bar for user definability in its category. It is used at virtually every point in the mortgage lifecycle, as well as for a wide range of risk-prone business operations outside traditional mortgage origination and servicing. ARMCO’s consultative approach to customer relationships leverages 25 years of mortgage risk intel, assuring that its clients are using the most effective risk mitigation strategies, and are using the fastest, most reliable, most efficient means for preventing risk-related loss. ARMCO distributes the ARMCO Mortgage QC Industry Trends Report, a free quarterly analysis of industry-wide mortgage loan quality. For more information, visit www.acesquality.com or call 1-800-858-1598.
MEDIA CONTACT:
Jeri Yoshida
Yosh Communications
jeri@yoshcomm.com
310 651 0057
