ACES’ Mortgage QC Industry Trends Report represents an analysis of nationwide quality control findings based on data derived from the ACES Quality Management & Control Software.
Executive Summary
QC Industry Trends – Overview
QC Industry Trends – by Category
QC Industry Trends – by Loan Purpose
QC Industry Trends – by Loan Product Type
Economic Discussion
Conclusion
About this Report
Executive Summary
This report represents an analysis of post-closing quality control (QC) data derived from loan files analyzed by the ACES Quality Management and Control® benchmarking system during the fourth quarter of 2023 (Q4 2023) and the full calendar year 2023 (CY 2023). The report incorporates data from prior quarters, where applicable.
Findings for the Q4 2023 Trends Report were based on quality control data from tens of thousands of unique records. Volumes are essential to this analysis, and the included records reflect trends in overall origination volumes. However, data from additional lenders is added to this analysis once the lender’s QC review seasoning within the ACES software reaches the 12-month bar. Therefore, the overall volume in the QC Trends Report does not precisely mirror the overall market. All reviews and defect data evaluated for this report were based on post-close loan audits selected by lenders for full file reviews.
Defects are categorized using the Fannie Mae loan defect taxonomy. Data analysis for any given quarter does not begin until 90 days after the end of the quarter to allow lenders to complete the post-closing quality control cycle, resulting in a delay between the end of the quarter and our publication of the data.
NOTE: A critical defect is defined as a defect that would result in the loan being uninsurable or ineligible for sale. The critical defect rate reflects the percentage of loans reviewed for which at least one critical defect was identified during the post-closing quality control review. All reported defects are net defects.
Summary of Findings
The overall critical defect rate decreased to 1.53% in Q4 2023, marking five consecutive quarters of decline. Defects improved in only two of the four major underwriting categories. Refinance review share edged up slightly, while defect share improved. Purchase review share decreased marginally, but defect share increased. Conventional and FHA review share decreased, whereas USDA review share increased. VA review share remained flat. Defect share increased across all loan types except conventional, though FHA defect share only rose nominally compared to USDA and VA.
For CY 2023, the overall critical defect rate averaged 1.68%, representing a nearly 20% year-over-year decline from 2022. Once again, defects increased overall in three of the four underwriting categories, as did five out of the nine total defect categories tracked in 2023. Although purchase review and defect share both increased over 2022, review share outpaced defect share, indicating improved performance throughout the year. Similarly, refinance review and defect share both declined, with review share also outpacing defect share. From a loan type perspective, review share decreased year-over-year for conventional and USDA loans and increased for FHA and VA loans. Regarding defects, USDA and VA loan performance improved overall in 2023 from 2022, while FHA and conventional performance declined.
Highlights include the following findings:
- The overall critical defect rate declined 8.38% over Q3 2023, ending the quarter at 1.53%.
- The overall rate for CY 2023 was 1.68%, down 19.18% from CY 2022.
- Of the four major underwriting categories, Credit and Liabilities improved in Q4 2023, while defects increased for Assets and Income/Employment. However, only one category – Credit – improved overall for CY 2023.
- Income/Employment remains the leading category of defects reported in Q4 2023, with Assets and Borrower and Mortgage Eligibility completing the top three categories of defects cited.
- Income/Employment and Assets were also the top two most cited defect categories for CY 2023, with Loan Documentation in third place.
- The sub-category analysis for both Q4 2023 and CY 2023 showed a tremendous increase in Calculation/Analysis-related errors for the Assets category. Eligibility-related defects also increased in the Credit and Income/Employment categories in Q4, while CY 2023 saw moderate increases in Credit Documentation, Income/Employment Analysis and Eligibility.
- Purchase review share decreased by 1.34% over Q3, while refinance review share increased by 8.79%. Defect-wise, purchase share increased by 6.28%, and refinance share decreased by 36.2%.
- VA review share increased the most in 2023, rising 19.44%, followed by a 4.46% increase in FHA review share. USDA review share declined by 15.63%, as did conventional by 4.22%.
- While FHA defect share increased by 1.85% quarter-over-quarter, USDA and VA loans experienced the most increases in Q4, rising 8.62% and 8.48%. While USDA review share also increased in Q4, VA review share remained relatively flat.
- For CY 2023, conventional and FHA defect share increased 5.83% and 11.6%, respectively. Defect share decreased by 68.15% for USDA loans and 26.61% for VA loans.
QC Industry Trends – Overview
With five straight quarters of decline, it’s evident lenders are prioritizing loan quality in the current market. The overall critical defect rate for Q4 2023 dropped to 1.53%, among the lowest rates observed since this report’s inception. While declining volume makes originating quality loans much easier, one can easily argue that today’s borrowers bring more challenging qualification scenarios to the table. In any event, the continuing downward trend in defects overall is a bright spot in an otherwise depressed market.
Overall, CY 2023 experienced less rate volatility than CY 2022 when rates began the year at 3.22% and proceeded to increase nearly 100 basis points (bps) quarter-over-quarter, peaking at just over 7% twice in Q4 2022. However, that may be the only positive rate-related news for CY 2023, as rates entered January 2023 at 6.48% and continued to move within the 6% range until crossing the 7% threshold in mid-August. By the start of Q4, rates reached 7.49% and peaked in late October at 7.79% before trending downward to end the year at 6.61%1.
Unsurprisingly to anyone in the trenches, the rate environment profoundly impacted originations, with lenders issuing 1.35 million mortgages in Q4 2023 totaling $417.4 billion. This total represents a unit-wise decline of 13.8% quarter-over-quarter and 16.5% year-over-year, while volume dropped 14.9% over Q3 and 18.6% from Q4 20222.
1 https://fred.stlouisfed.org/series/MORTGAGE30US
2 https://www.attomdata.com/news/market-trends/mortgage-origination/q4-2023-u-s-home-loan-origination-report/
Critical Defect Rate by Quarter: Q1 2023 — Q4 2023
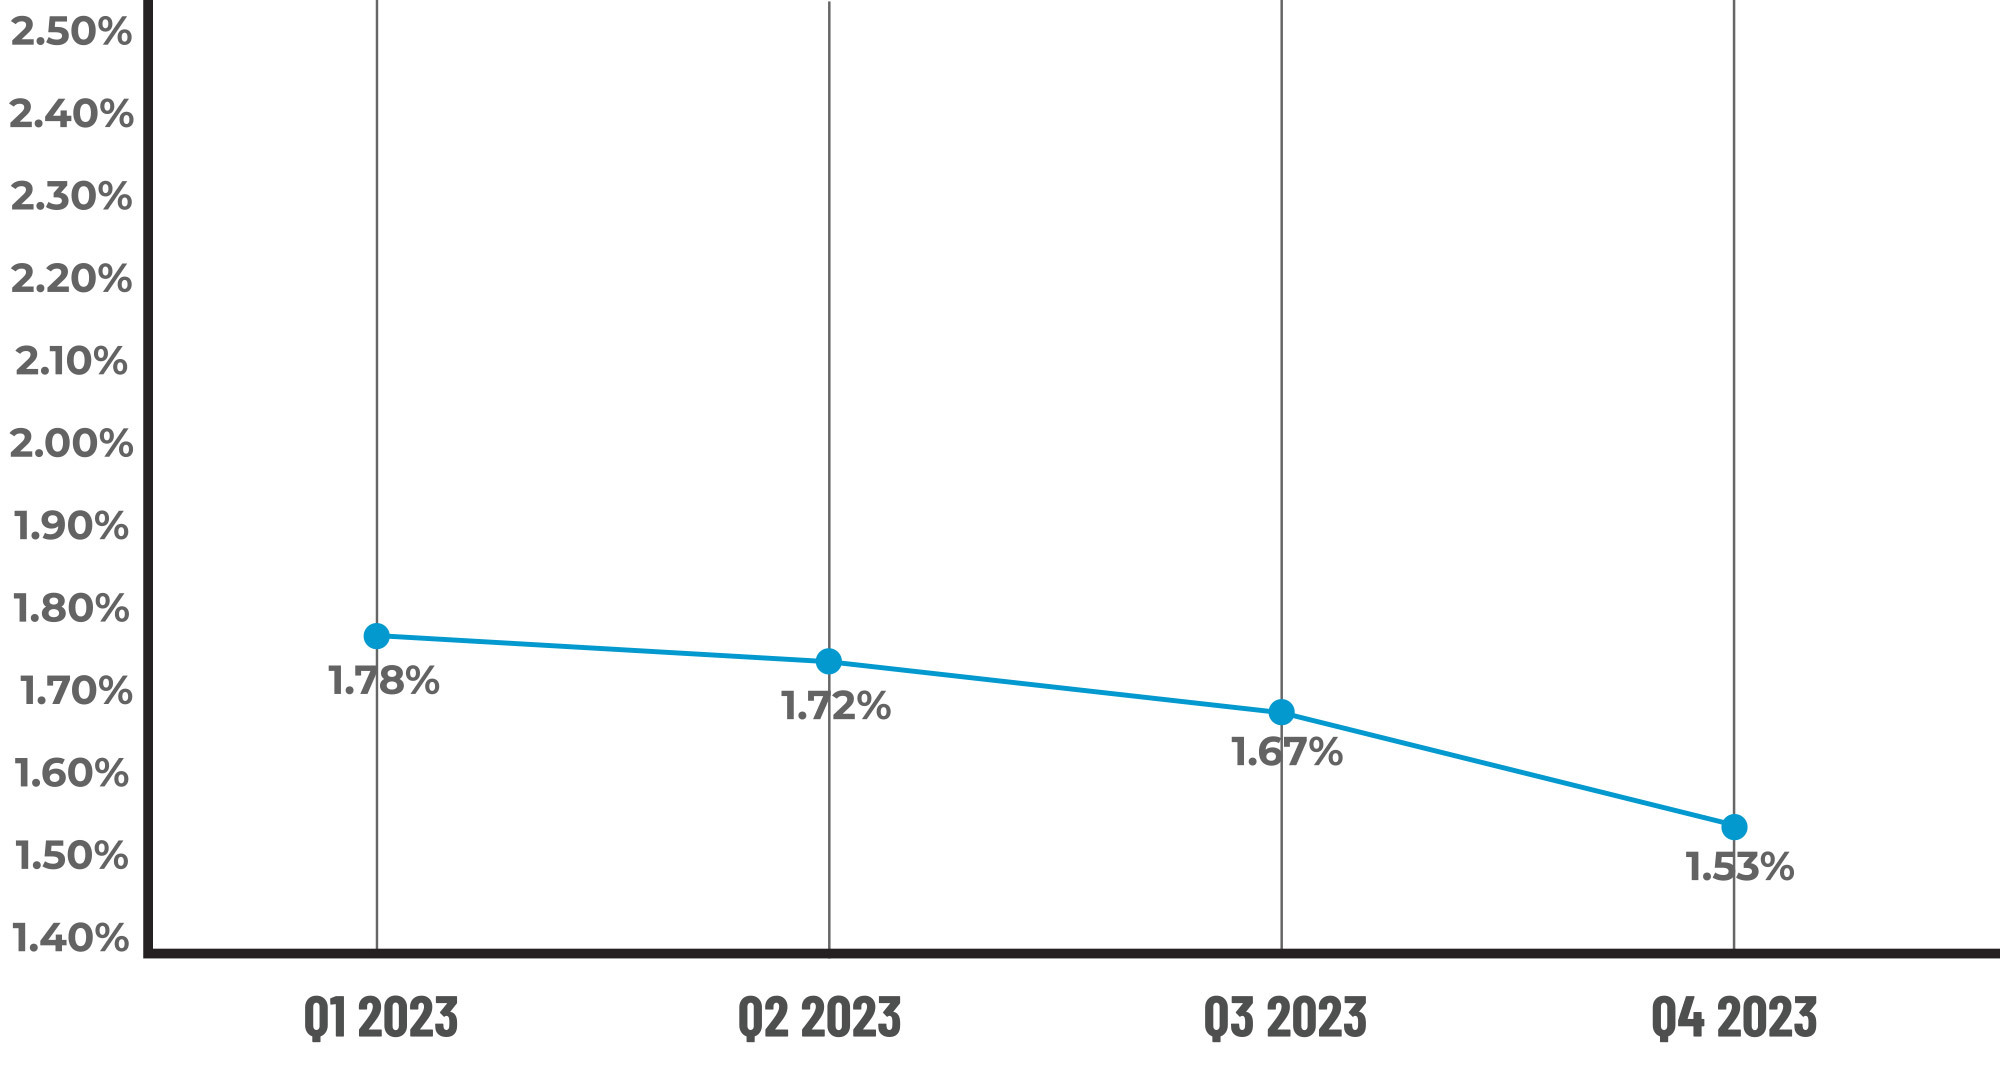
Figure 1 displays the percentage of loans with critical defects by quarter, for Q1 2023 through Q4 2023.
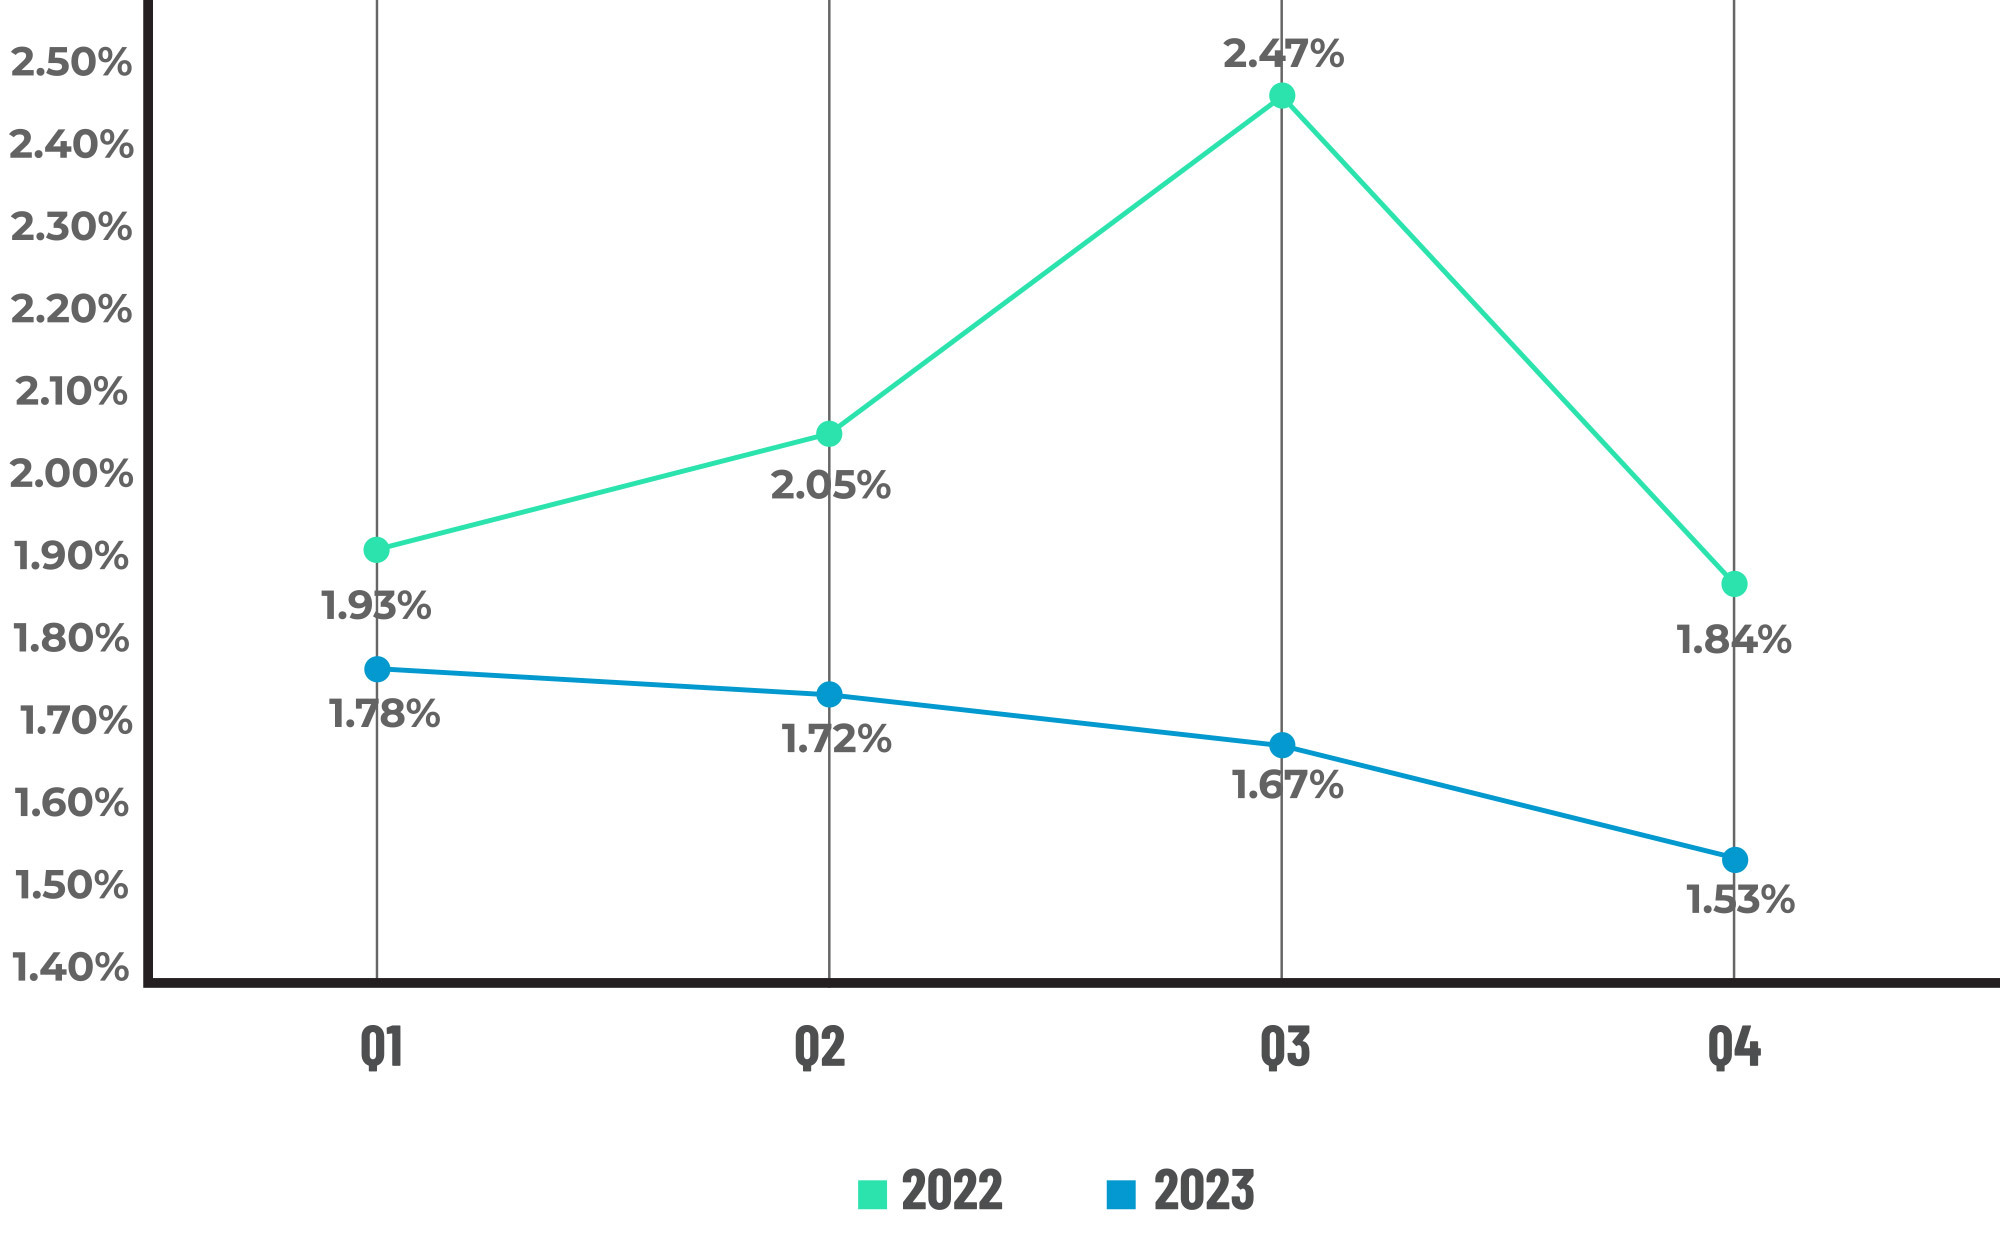
Figure 2 displays the percentage of loans with critical defects by quarter for each quarter in CY 2022 and CY 2023.
QC Trends by Defect Category
The defect category trends headline for Q4 2023 seems to be, “When history repeats itself.” In last year’s report, Income/Employment was not only the leading category of defects, but total defect share in this category hit 36.91%. The second and third leading categories in Q4 2022 were Assets at 18.12% and Borrower and Mortgage Eligibility at 14.09%. While the totals for Q4 2023 may be slightly different, the cast of characters is the same, with the same three categories holding the same top three spots. Total defects in the Income/Employment category increased by 57.44% over Q3 2023 to 36.84%, while Assets increased by 10.83% to 17.29%. Borrower and Mortgage Eligibility actually decreased by 21.64% to 12.78% but remained ahead of Loan Documentation, which also declined by 45.01% to 10.53%.
Due to pronounced increases in the Borrower and Mortgage Eligibility and Loan Documentation categories in Q3 2023, last quarter’s report included a sub-category analysis of these areas. While the root causes of defects in Loan Documentation were attributed to sloppiness in the manufacturing process, the issues within Borrower and Mortgage Eligibility dealt more with underwriting errors. The decline in defects in both these categories in Q4 indicates that lenders have gotten a better handle on issues in these areas.
Looking at the “Big 4” underwriting categories, defects increased in Income/Employment and Assets in Q4, while Credit and Liabilities both declined. The sub-category analysis shows that Calculation/Analysis errors are primarily responsible for the 10.83% quarter-over-quarter increase in Asset defects and the 57.44% increase in Income/Employment defects. However, Documentation-related defects did edge up slightly for Income/Employment as well.
Once again, the pressure to qualify as many borrowers as possible is the likely culprit behind these errors. Income calculation has become especially complex as borrowers bring more unique scenarios to the table. Fannie Mae has introduced enhancements to its online income calculator to help lenders improve accuracy in this area, and it would behoove lenders to take advantage of this tool to improve loan quality in this critical area.
Examining 2023 as a whole, what’s interesting to note is the year-over-year decline in the overall critical defect rate despite seeing defect increases in five of the nine defect categories tracked this year. [NOTE: The Title/Lien category was replaced by Insurance for 2023.] While the decline in origination volume certainly contributed to this phenomenon, the significant improvements in the remaining four categories likely helped mitigate the more modest increases observed throughout the year. The Credit category improved the most year-over-year, declining by 26.56%, followed by a 22.59% improvement in Legal/Regulatory/Compliance and an 18.89% improvement in Insurance. Loan Documentation defects improved marginally by 0.97%.
While Borrower and Mortgage Eligibility increased by 28.28% over CY 2022, it was the only category to cross the 20% threshold. Liabilities increased by 12.68%, followed by Assets at 11.16%, Appraisal at 2.67% and Income/Employment at 2.17%. However, the year-over-year increase in defects in the “Big 4” underwriting categories is cause for concern, given how vital these areas are to borrower health and long-term loan performance.
The year-over-year increase in Asset defects seems moderate on the surface, but the sub-category analysis shows a 117% jump in Calculation/Analysis-related defects. Though this area ultimately represented only 10% of defects within the category, the significant rise in what could be considered a more technical aspect than Documentation, which accounted for the vast majority of defects, is cause for concern.
Within the Income/Employment sub-categories, a 35.54% increase in Calculation/Analysis-related defects also accounted for the rise in defects alongside the 8.67% rise in Eligibility-related defects. However, the 23.88% improvement in Documentation-related errors helped offset defect growth, keeping the overall increase in Income/Employment defects minimal. While Credit improved tremendously, Documentation seemed to be the sticking point for this area, increasing 35.54% from CY 2022.
Critical Defects by Fannie Mae Category: Q4 2023
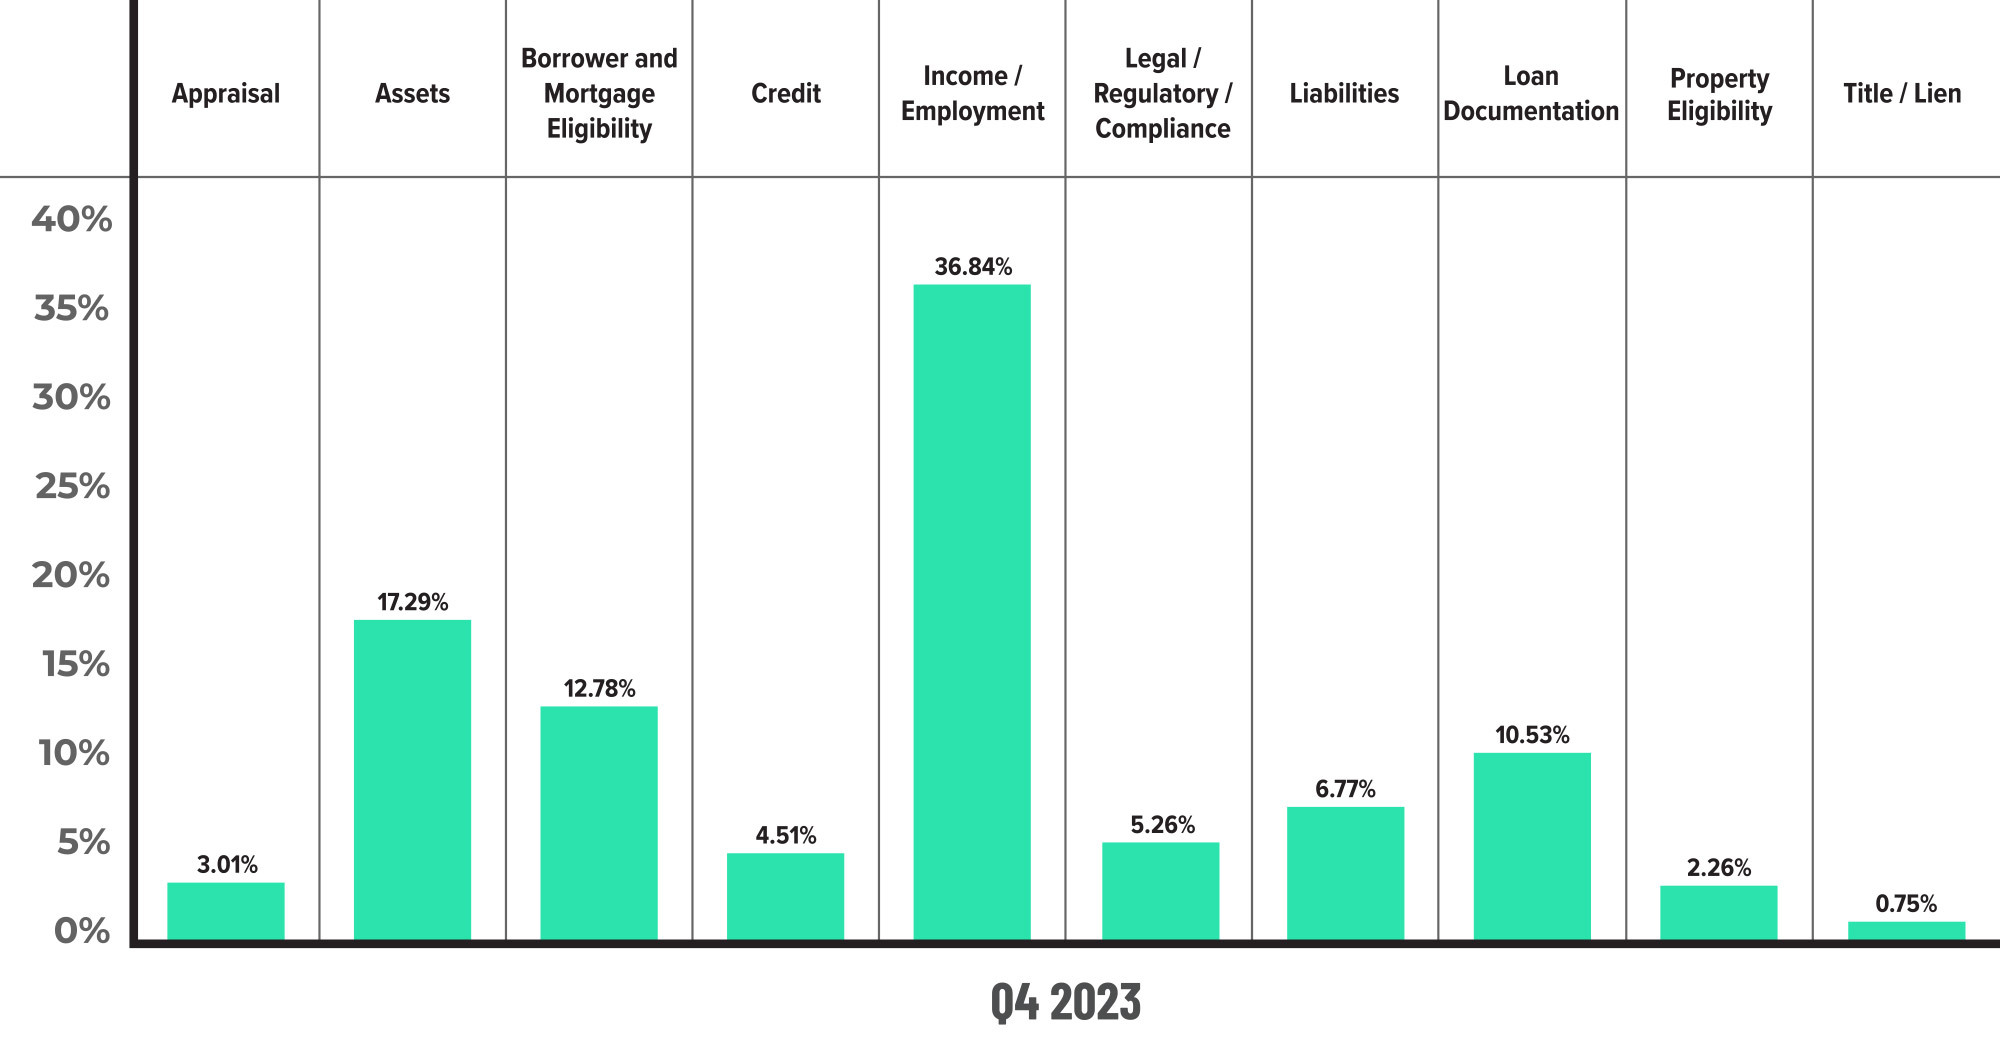
Figure 3 displays the dispersion of critical defects across Fannie Mae categories for Q4 2023.
Critical Defects by Fannie Mae Category: Q3 2023 vs. Q4 2023
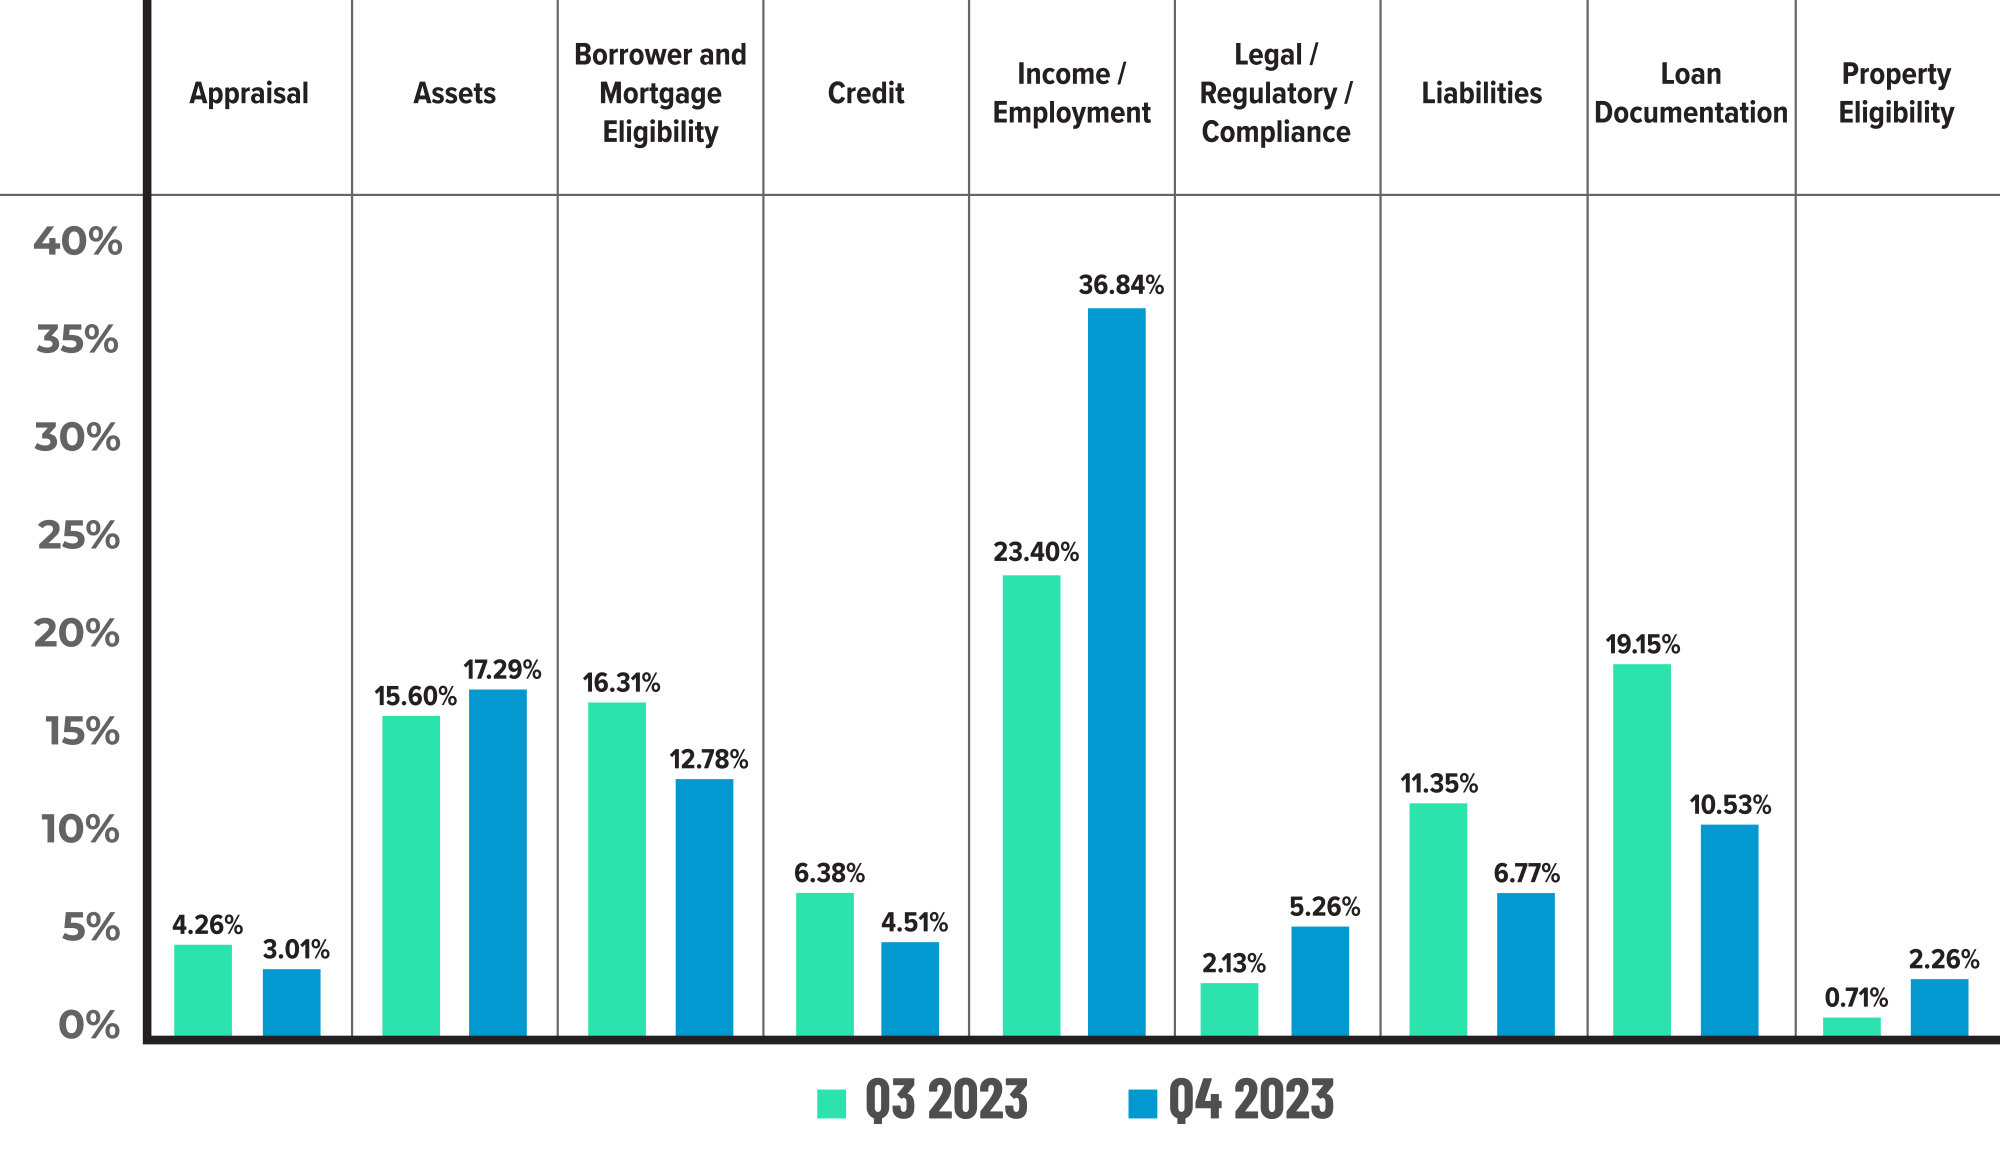
Figure 4 displays the critical defect rate by Fannie Mae category, comparing Q3 2023 to Q4 2023.
Critical Defects by Fannie Mae Underwriting Sub-category: Q4 2023
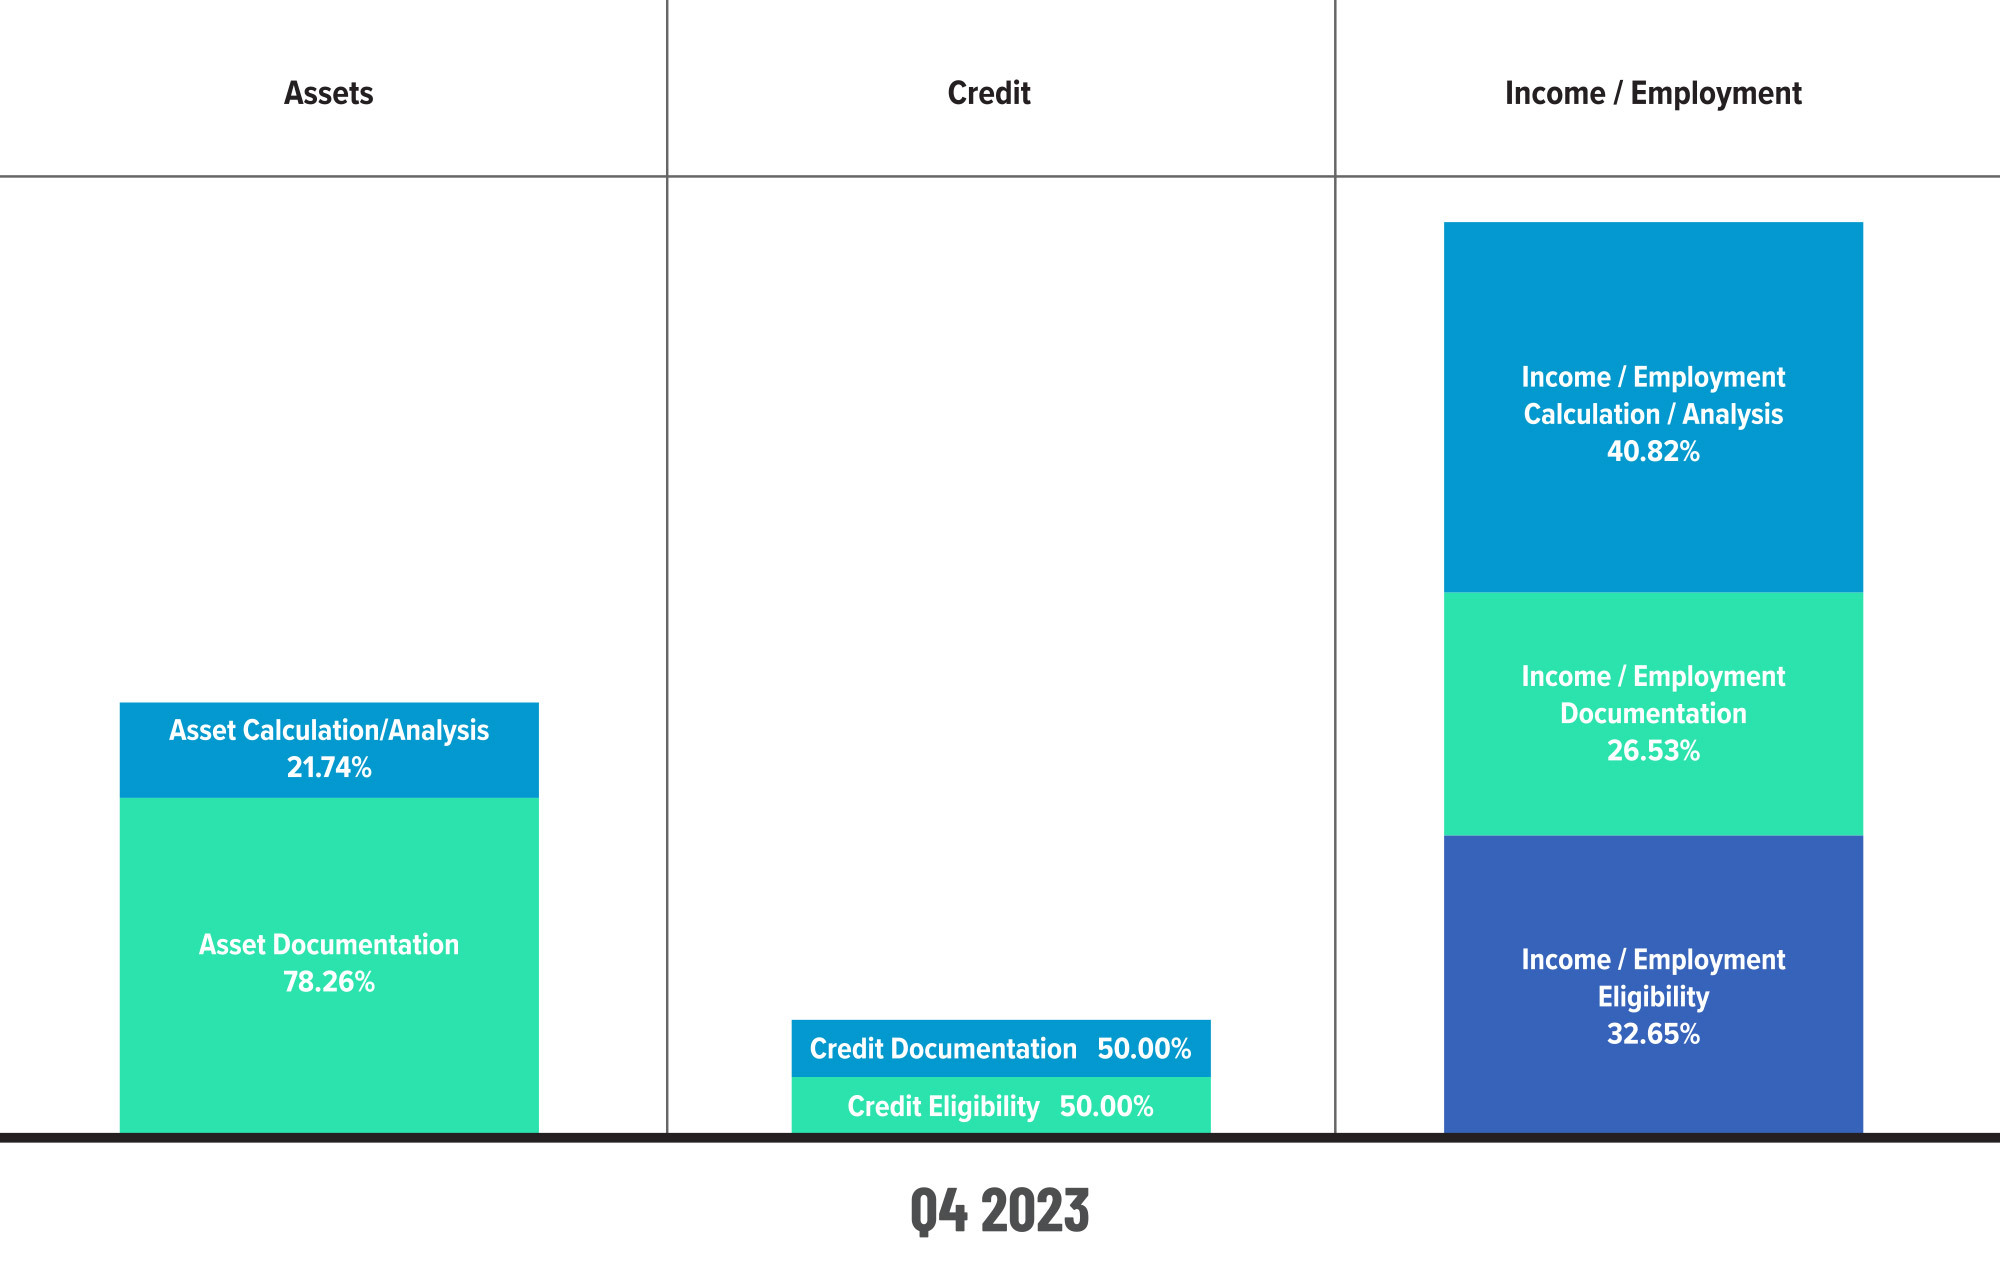
Figure 5 displays sub-category information for Q4 2023 within the Assets, Credit and Income/Employment categories.
Critical Defects by Fannie Mae Underwriting Sub-category: Q3 2023 vs. Q4 2023
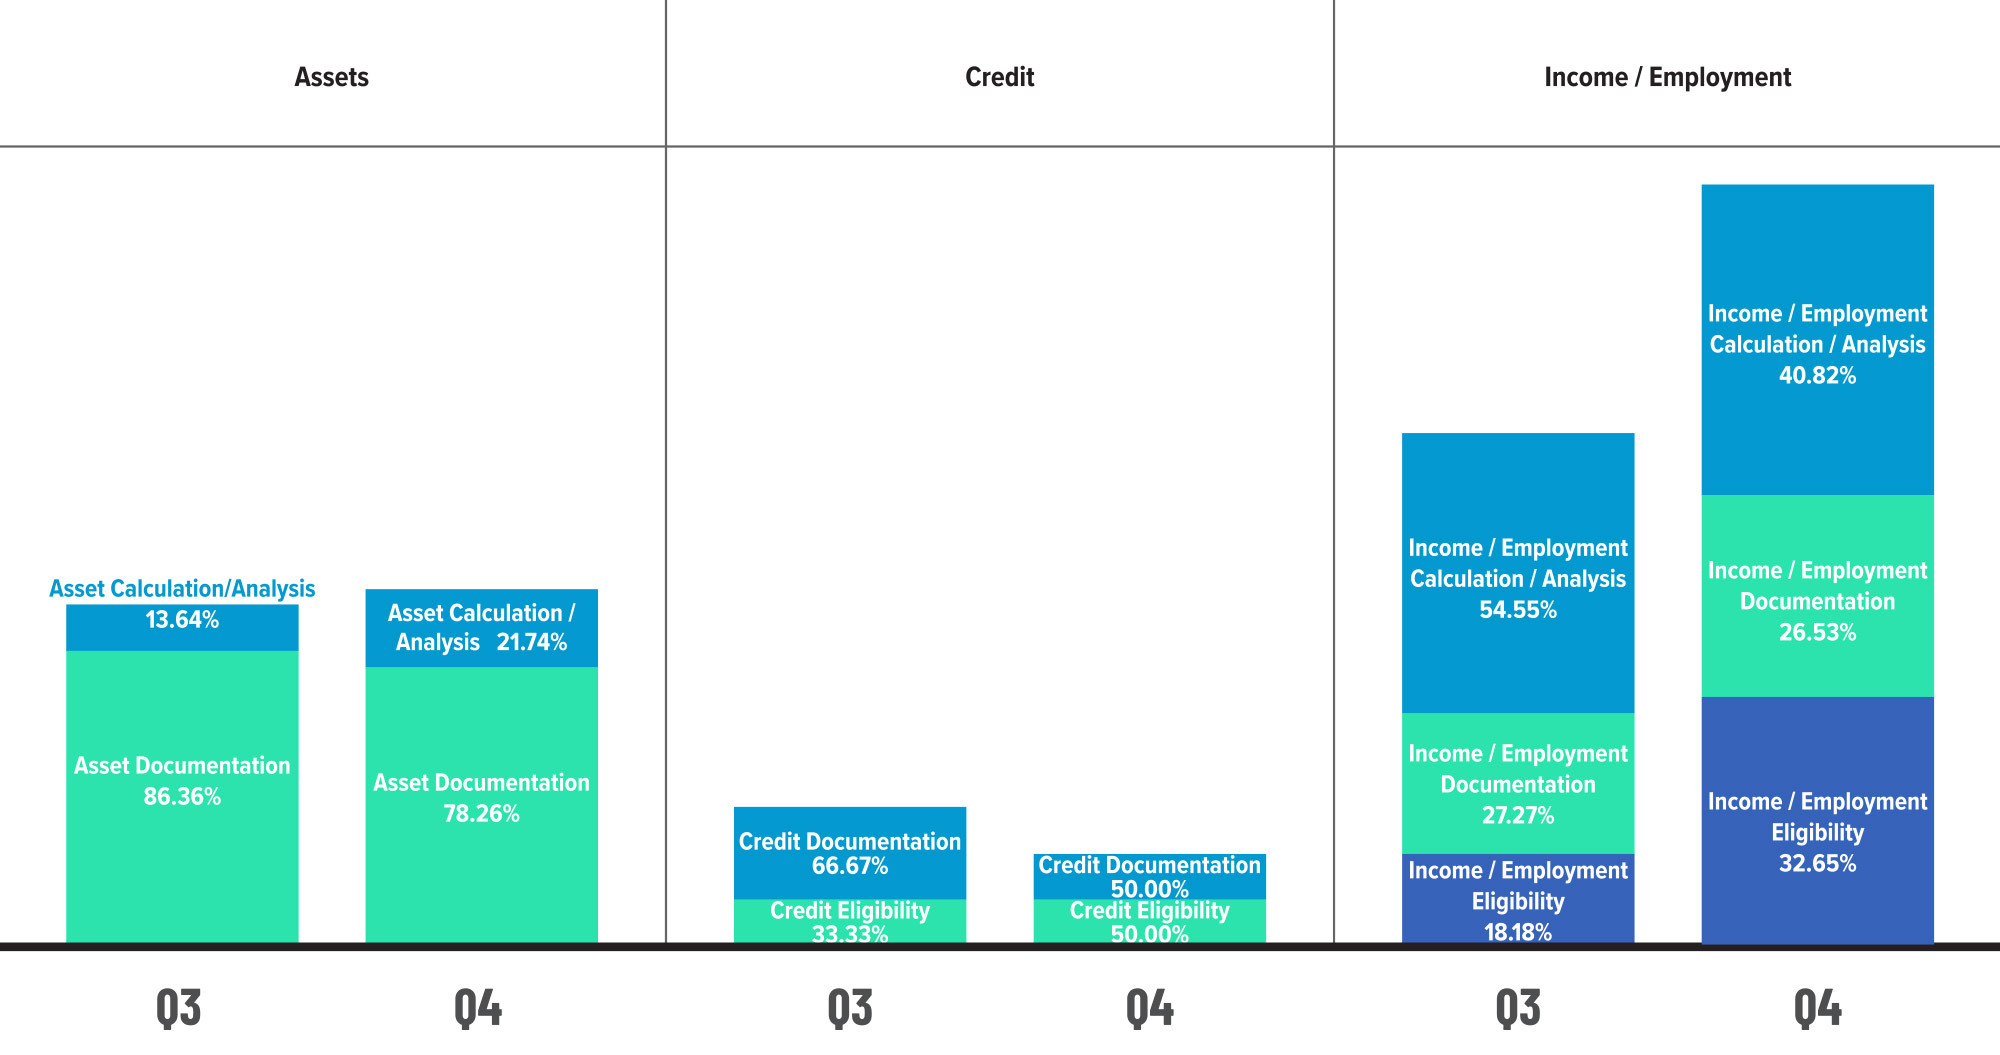
Figure 6 displays sub-category information within the Assets, Credit and Income/Employment categories, comparing Q3 2023 to Q4 2023.
Critical Defects by Fannie Mae Sub-category: CY 2022 vs. CY 2023
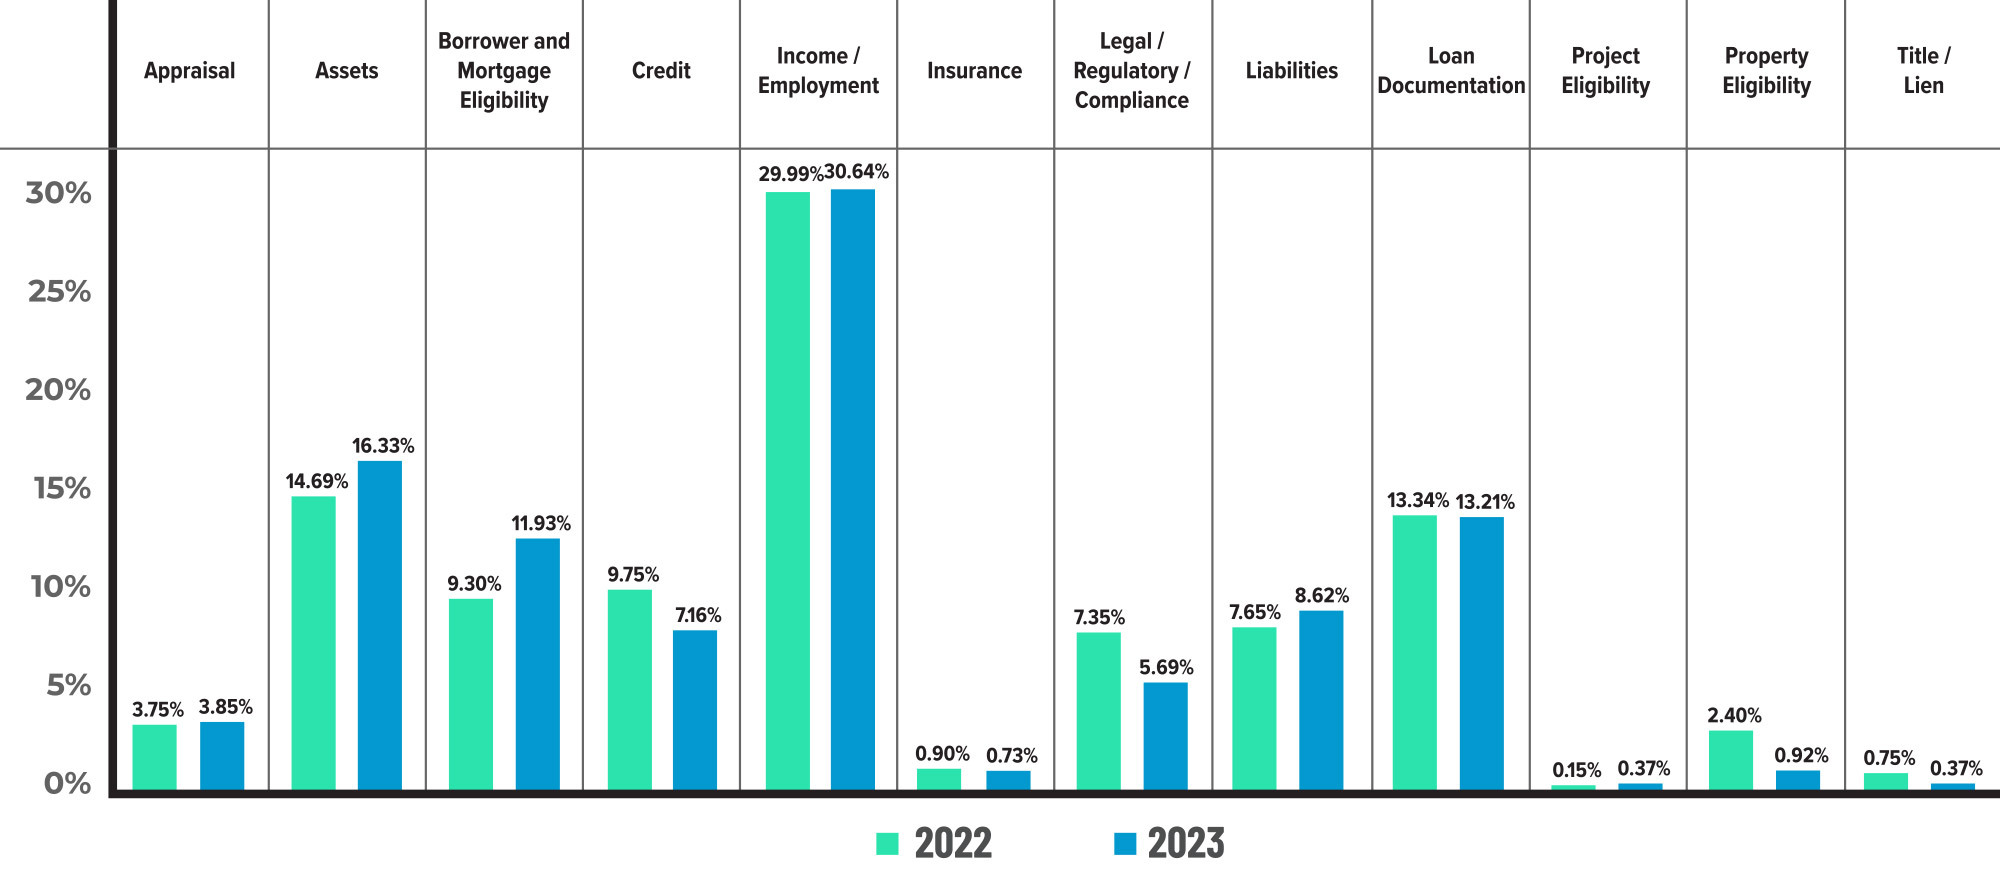
Figure 7 displays the critical defect rate by Fannie Mae category, comparing CY 2022 to CY 2023.
Critical Defects by Fannie Mae Sub-category: CY 2023
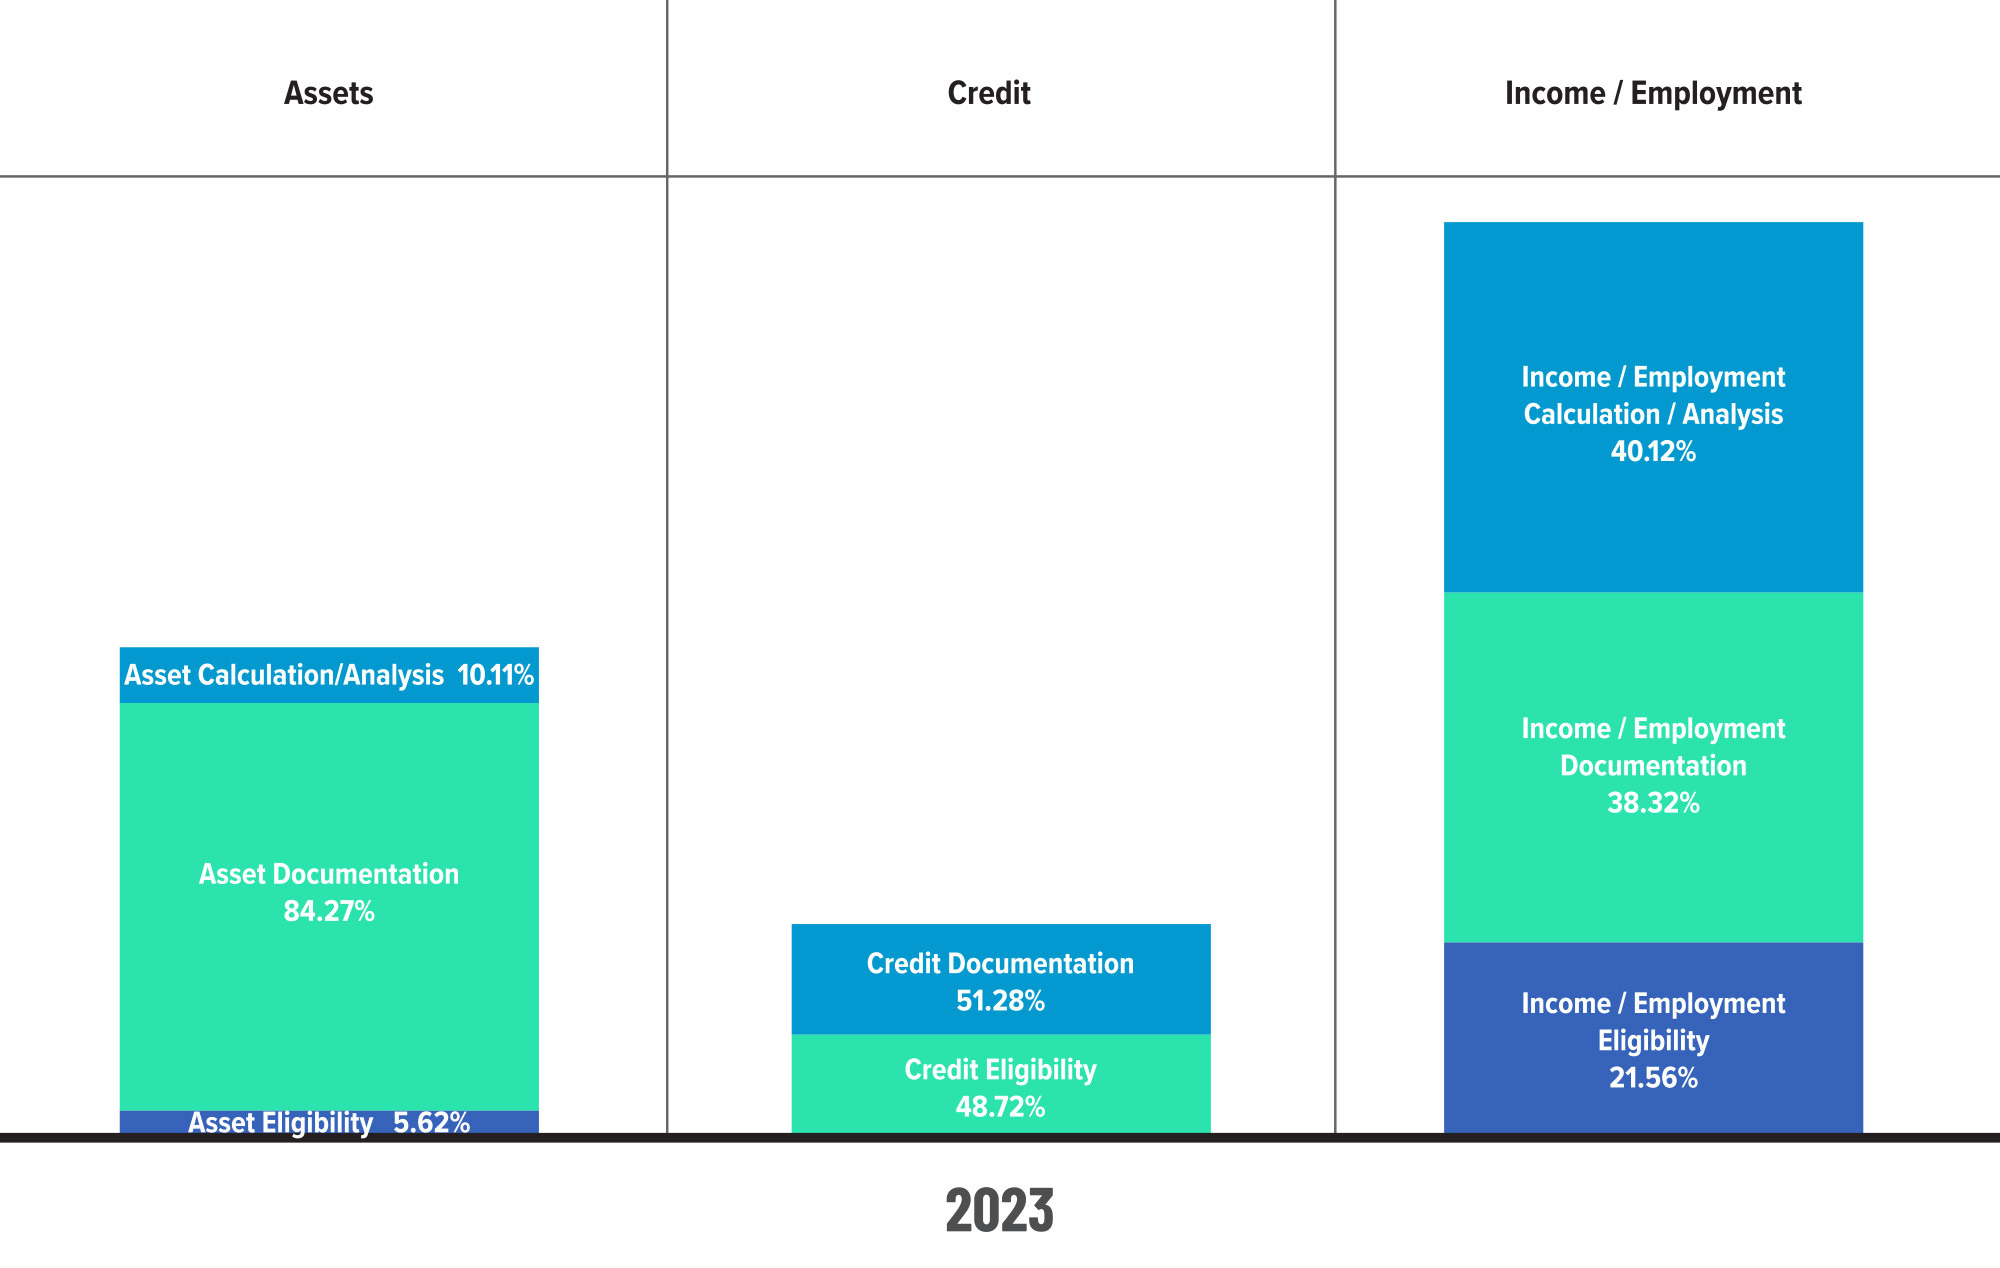
Figure 8 displays sub-category information for CY 2023 within the Assets, Credit and Income/Employment categories.
QC Trends by Loan Purpose
While purchase review share declined and refinance review share increased in Q4 2023, defect share trended in the opposite direction for both, with purchase defects rising 6.28% and refinance defects declining 36.20%. With rates remaining well above what borrowers secured during the pandemic, one would expect refinances to be few and far between, which explains the extra scrutiny lenders would conduct on these transactions in the current market. However, the uptick in purchase defects and decline in refinance defects indicates lenders’ efforts would be better placed elsewhere.
Considering all four quarters of 2023, it’s no surprise that both transaction types achieved relative defect parity for the year, as that’s been the case up until this most recent quarter. In a similar vein, the 16.25% increase in purchase review share and 44.74% decline in refinance share confirms what most in the industry already know, which is that we are firmly in the midst of a purchase-driven market. From a quality perspective, review share changes outpaced the year-over-year growth in purchase defects and decline in refinance defects, indicating that lenders are doing a solid job of maintaining loan quality overall.
Defects by Loan Purpose: Q4 2023
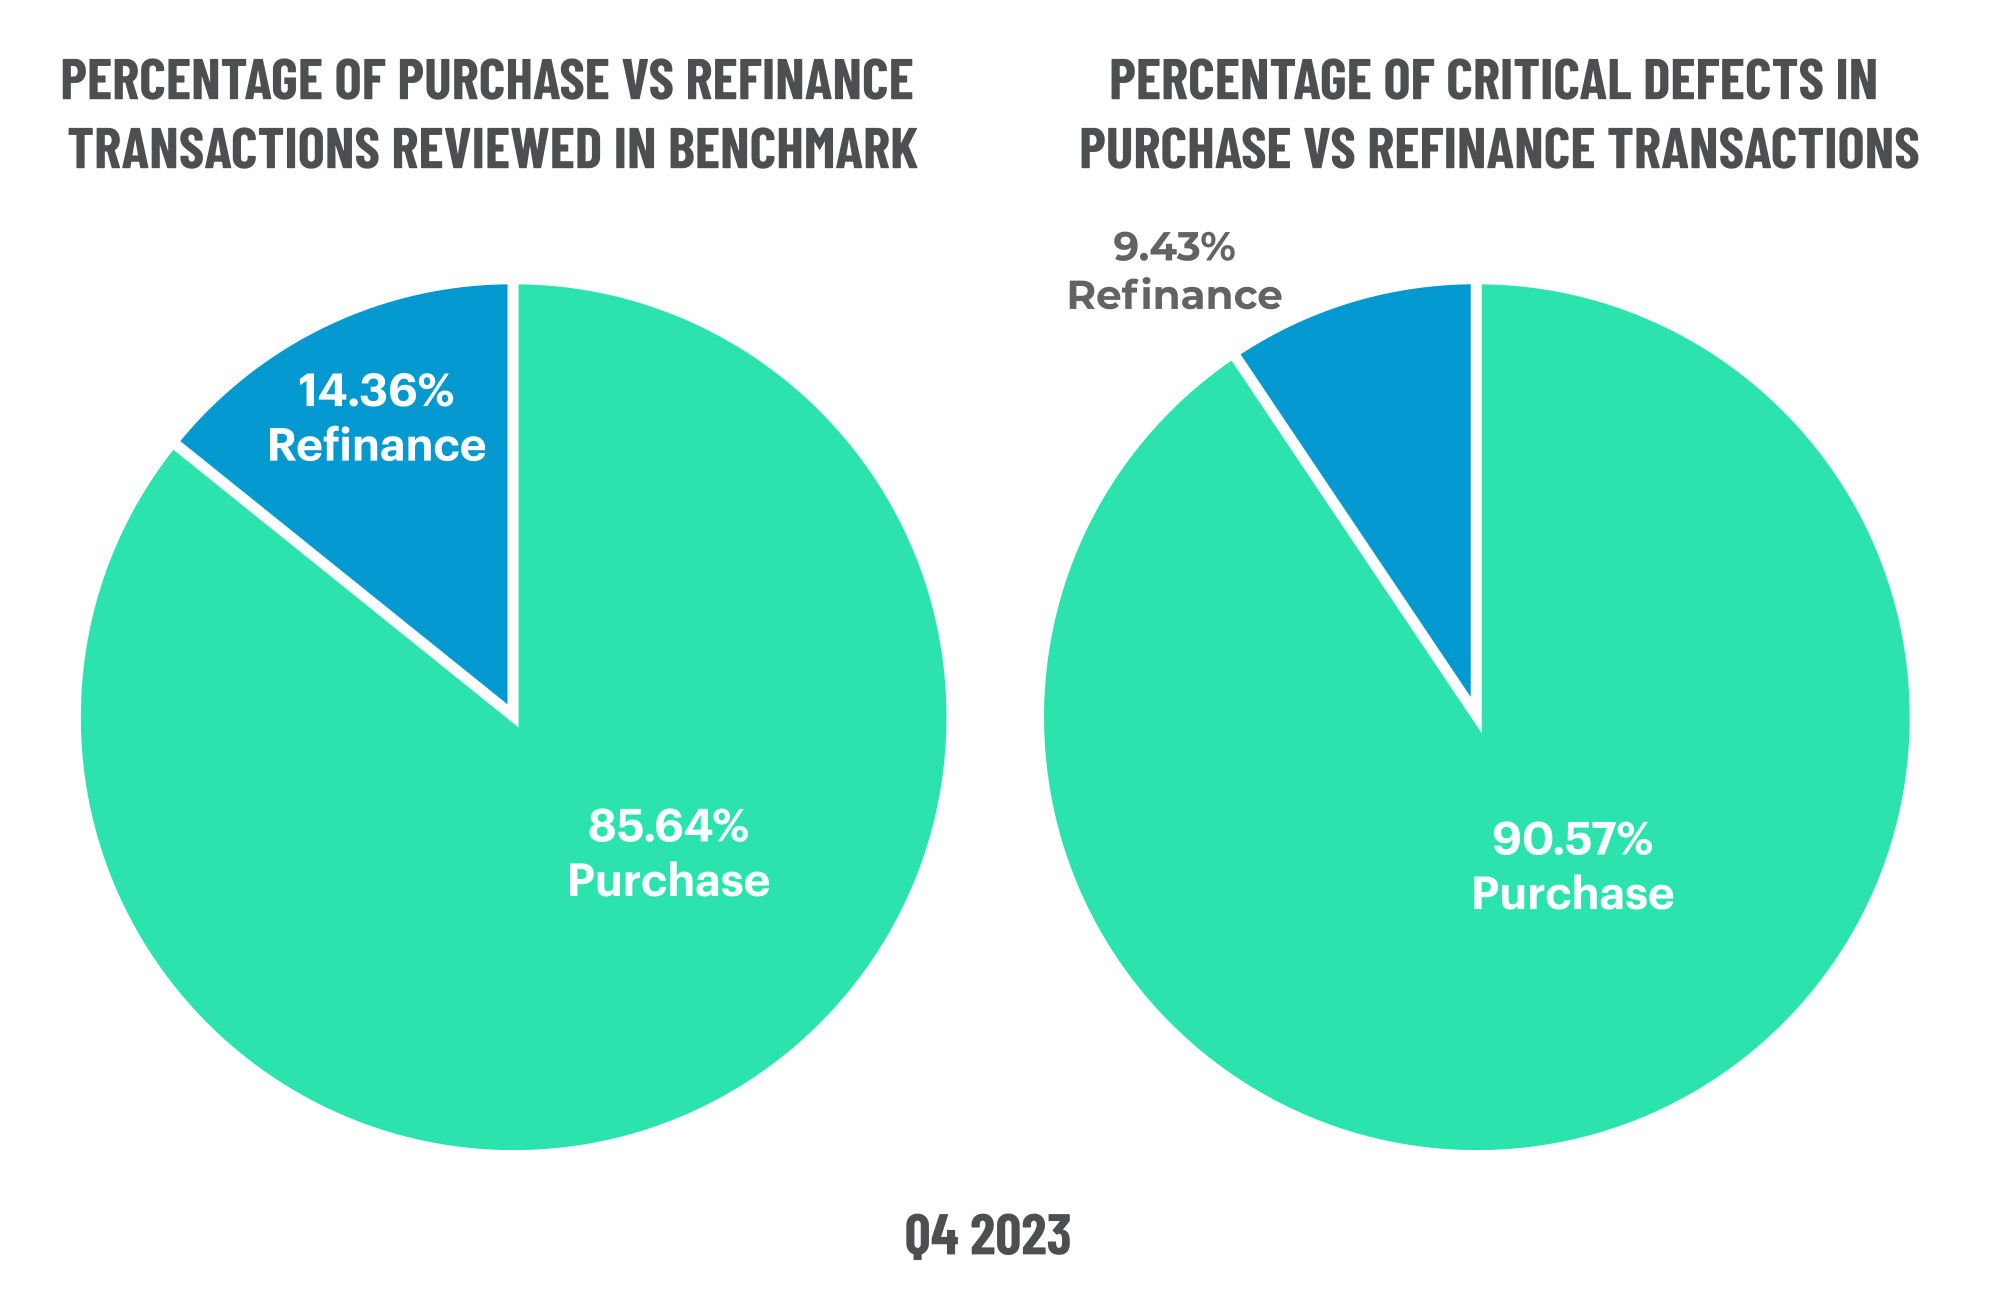
Figure 9 displays the loans reviewed and critical defects by loan purpose for Q4 2023.
Defects by Loan Purpose: CY 2023
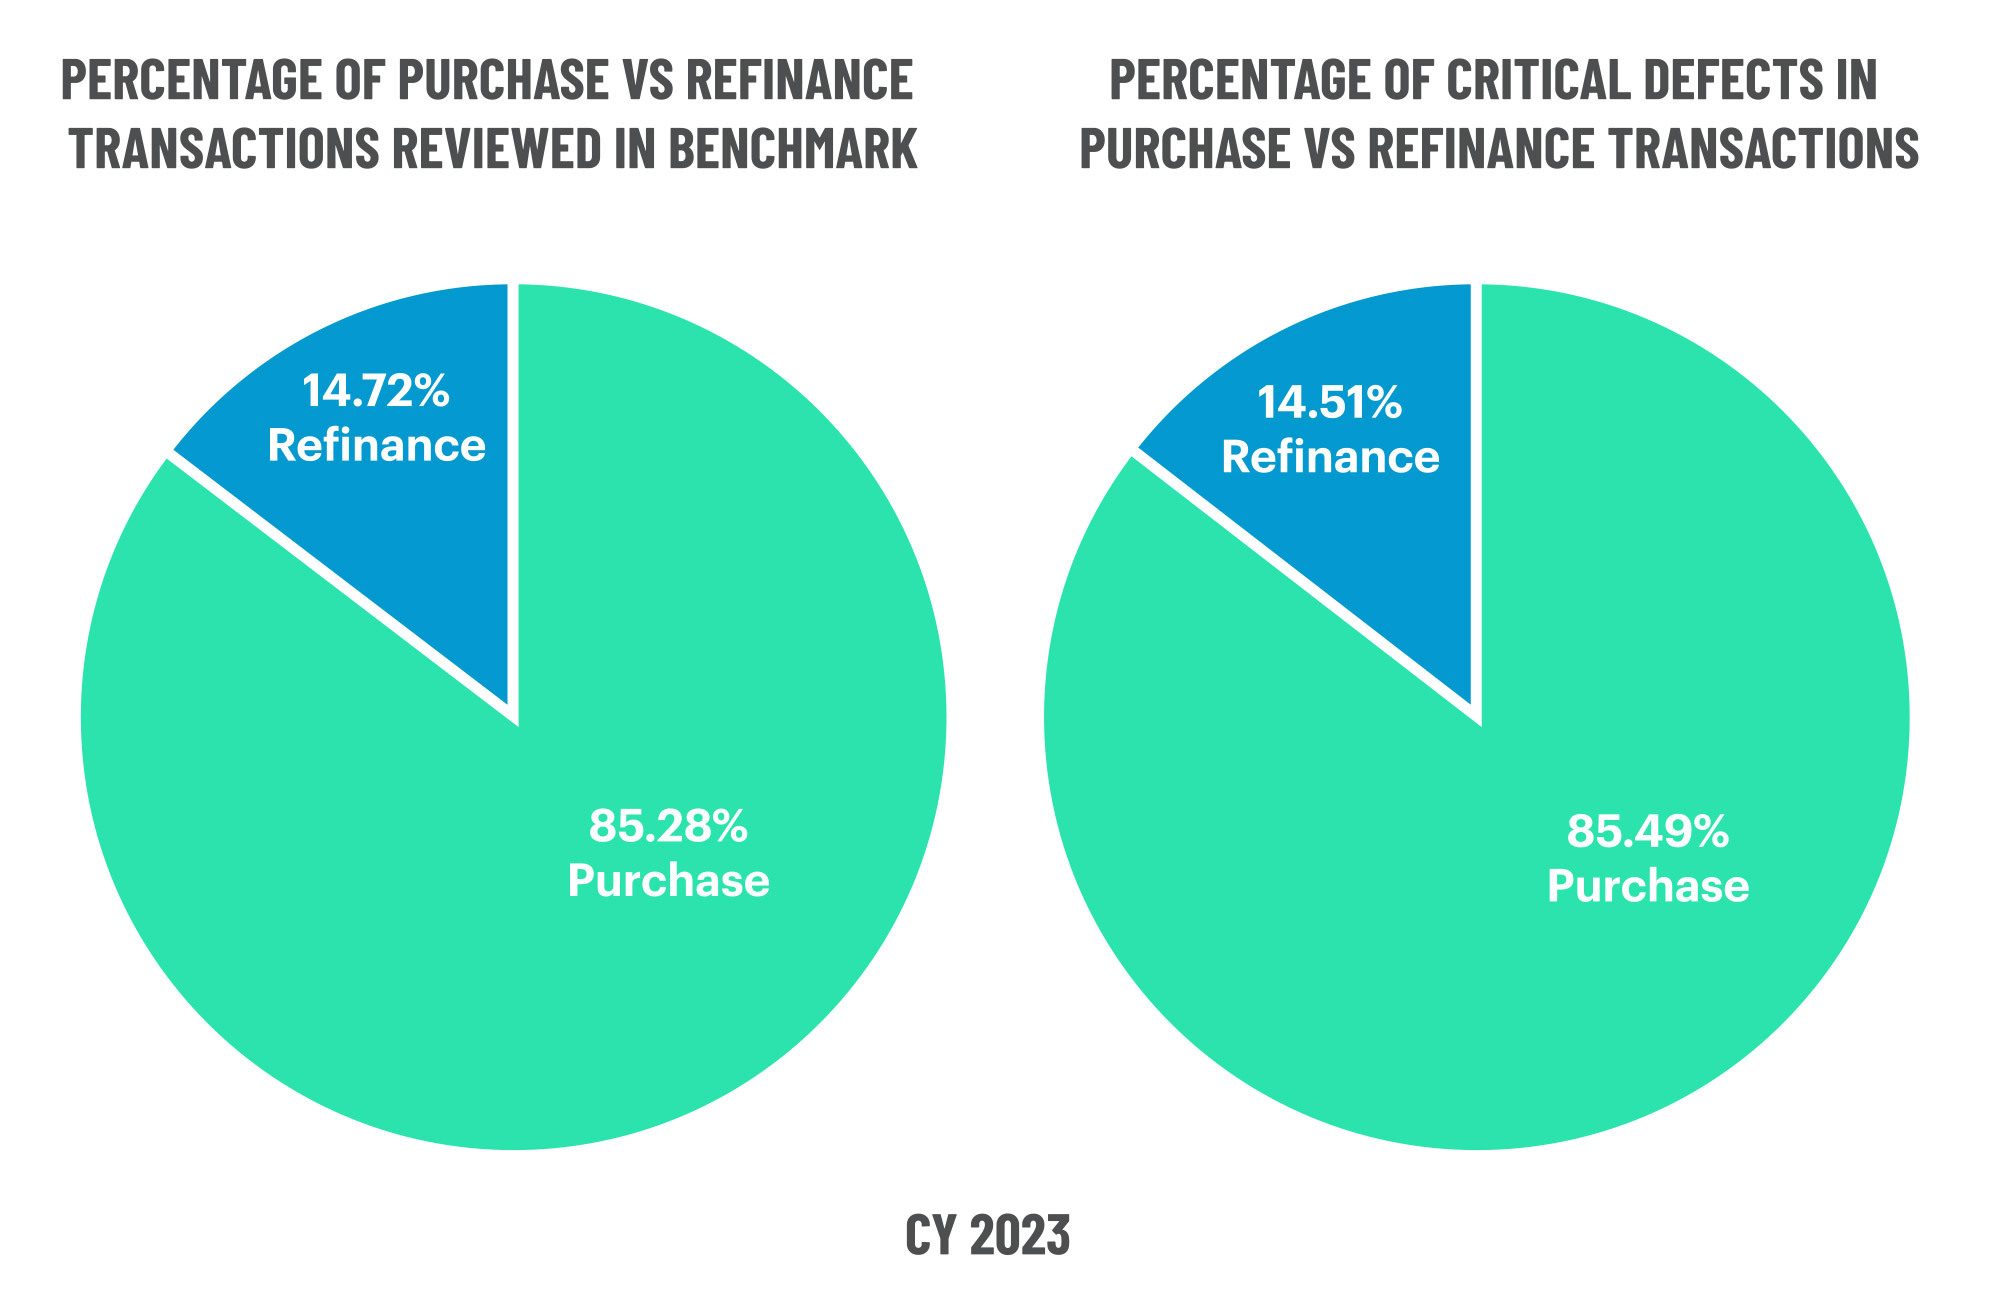
Figure 10 displays the loans reviewed and critical defects by loan purpose for CY 2023.
QC Trends by Loan Product Type
Of all product types reviewed in Q4 2023, USDA share increased the most, ending the quarter at 13.68%. Changes in the remaining loan product type were negligible, with VA rising by 0.98% and FHA and conventional declining by 1.04% and 0.3%, respectively.
Performance-wise, the increased scrutiny of USDA loans uncovered more issues, as defect share rose 8.62%. VA defect share also increased by 8.48%, which indicates a degradation in loan quality given the relatively flat quarter-over-quarter review share. Although FHA defect share increased again this quarter, the level of increase seems to be slowing. Last quarter saw defects increase by 3.47%, whereas Q4 only saw a 1.85% rise. Conventional defect share continued its downward trajectory, decreasing by 3.14%.
From an annual trending perspective, lenders focused more of their review efforts on VA and FHA loans in 2023, with review shares rising 19.44% and 4.64%, respectively. Conversely, USDA review share declined by 15.63%, while conventional review share dropped by 4.22%. Lenders’ efforts were rewarded in the USDA category with a 68.15% decline in defects over 2022. However, review strategies for other loan types in 2024 may require recalibration. VA defect share decreased by 26.61%, while FHA defects increased by 11.6%. Conventional defects also rose, albeit moderately, by 5.83%.
Defects by Loan Product Type: Q4 2023
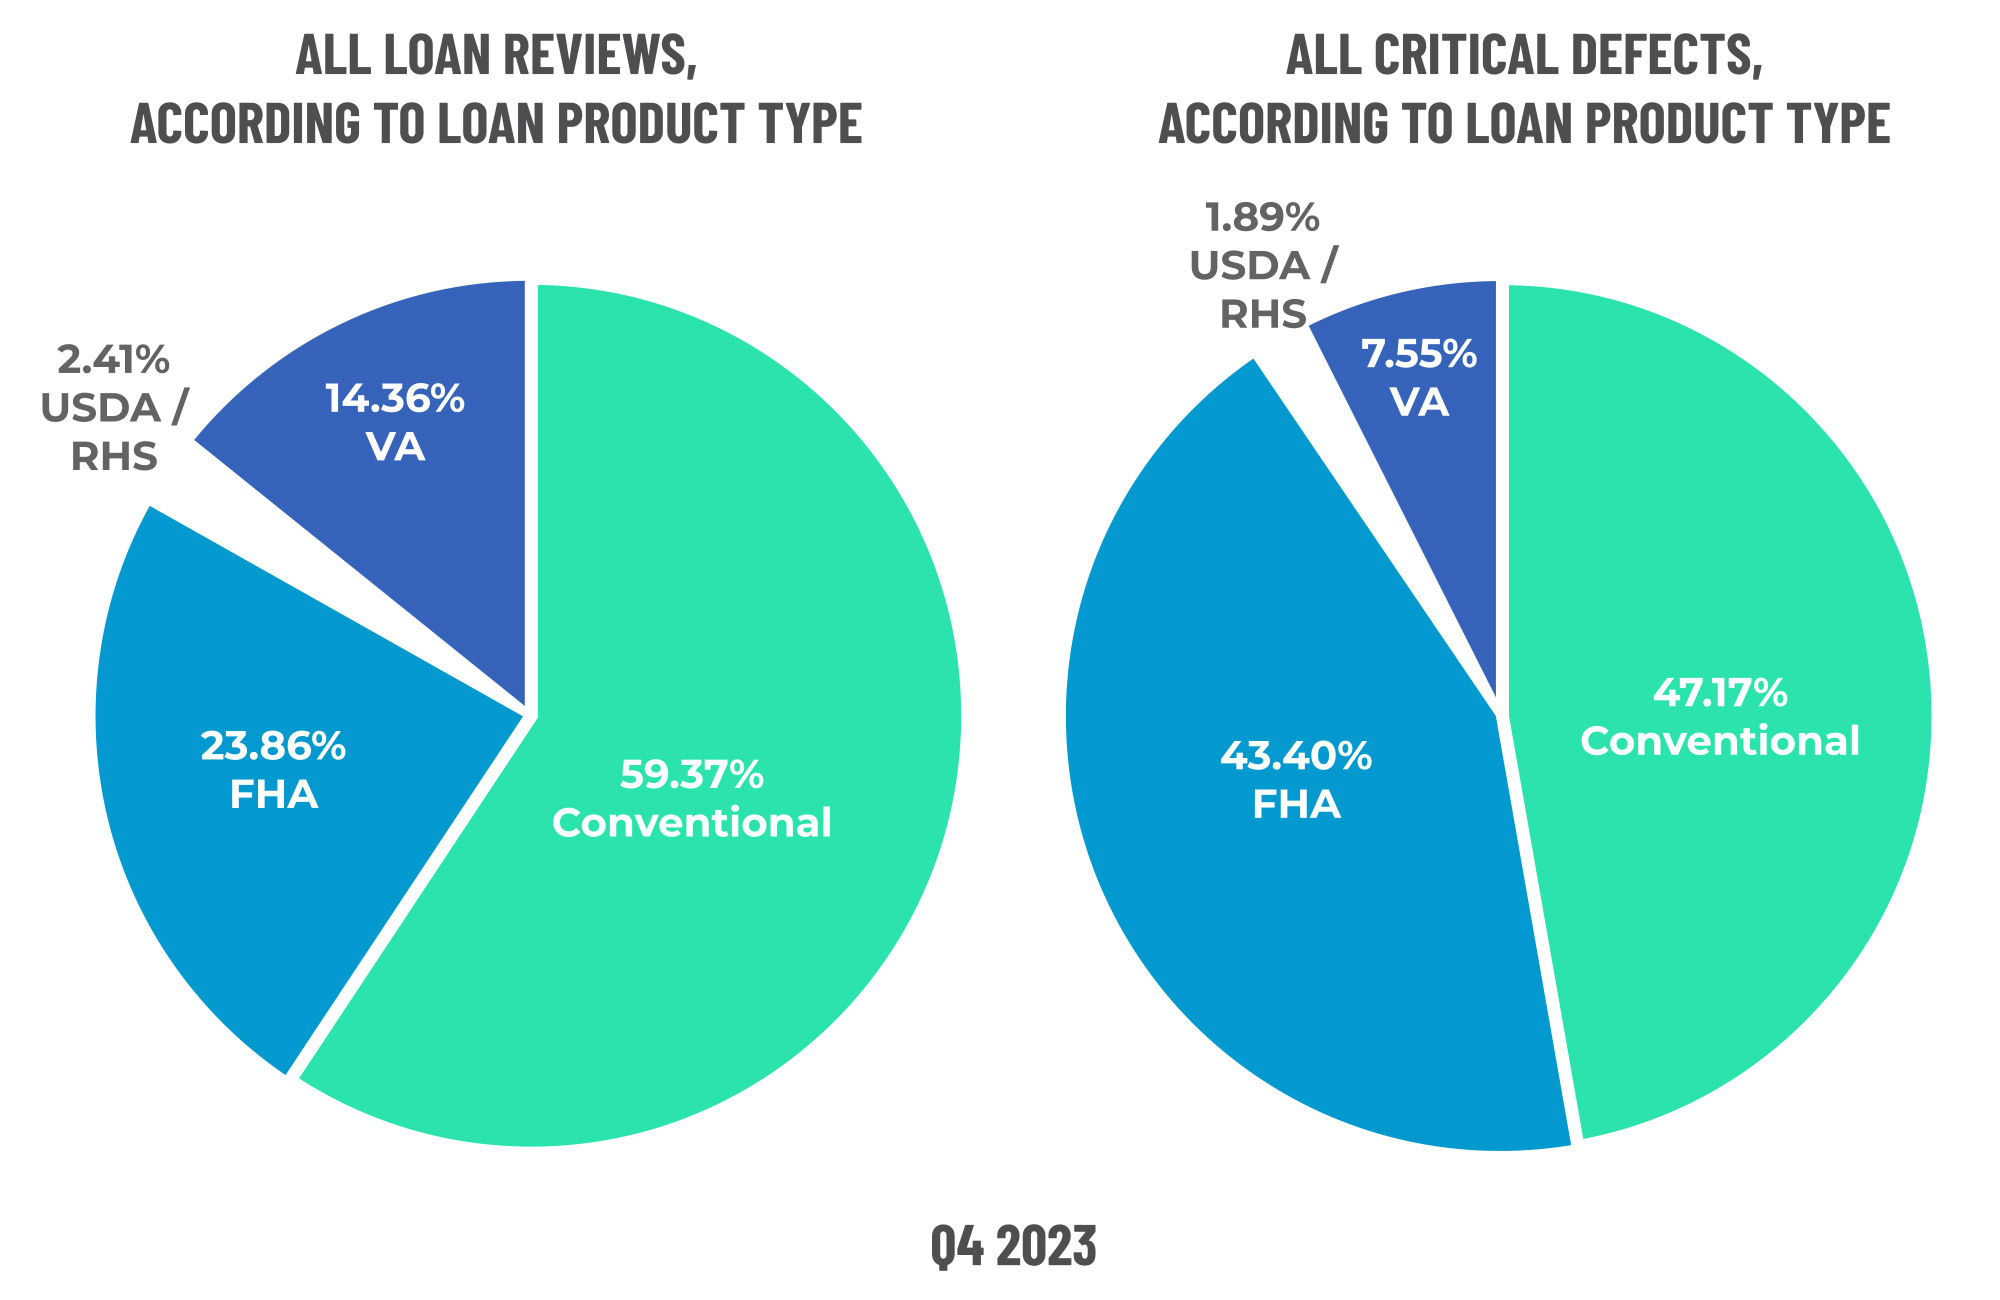
Figure 11 displays the loans reviewed and critical defects by loan type for Q4 2023.
Defects by Loan Product Type: CY 2023
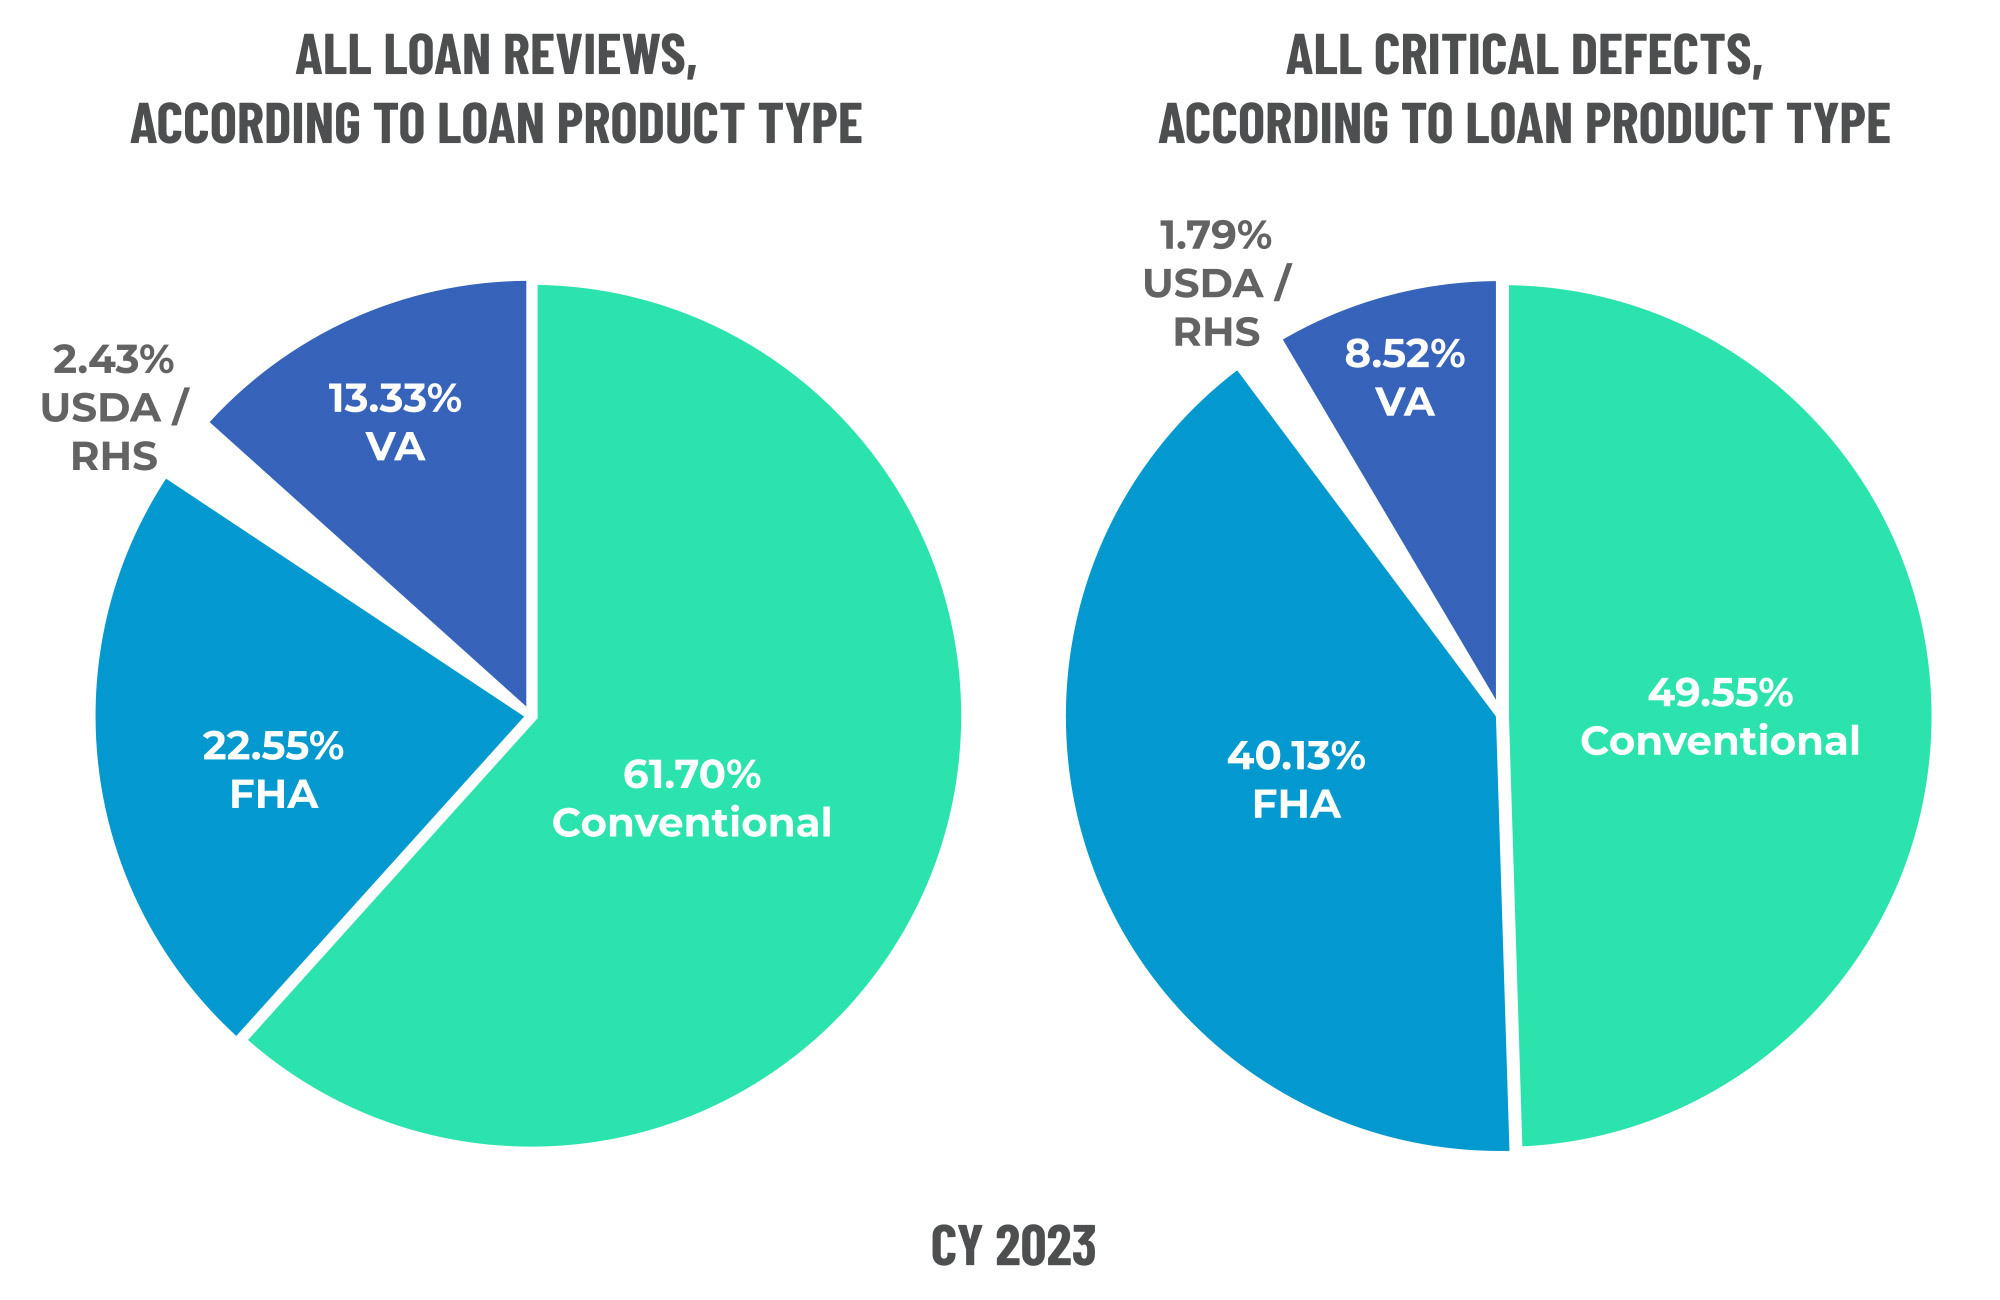
Figure 12 displays the loans reviewed and critical defects by loan type for CY 2023.
Economic Discussion
There were not a lot of bright spots in the mortgage industry for 2023, with headlines dominated by lenders shuttering and others exiting origination channels, plus the ever-present reports of expense reductions and declining profitability. Loan quality clearly bucked this trend. Even though lenders are under enormous pressure to qualify every loan, risk and quality control leaders are effectively serving their line-of-defense roles.
Even though the tail end of 2022 proved problematic, the deterioration of market conditions accelerated in 2023. To be clear, 2023 will not be remembered fondly by most industry participants. Lenders rushed to create new products and to introduce HELOCs and cash-out programs to capitalize on borrower needs – all while facing lower profitability, constant staffing changes and an overall gloomy outlook.
Loan quality
Segueing back to loan quality, Agency repurchase demands were another hot topic in 2023. As the agencies powered through their assessment of “boom time” production (2021 and early 2022), repurchases rose, and more stringent QC standards were implemented. As mentioned in our previous reports, getting clear and accurate data on repurchases is not easy to obtain. In public filings (SEC reports), we can glean that repurchase requests outstanding at Fannie Mae are down almost 50% from the end of 2022. Repurchase requests outstanding at Freddie Mac are down even more (61%).
The decline in those numbers is welcome news for lenders. However, the data shows what is still outstanding and does not give insight into how the previous demands were ultimately resolved (overturned, repurchases, indemnification, etc.). What is clear is that lenders should be moving out of the repurchase risk window from the pandemic era. This topic further reinforces the superb job that lenders and their QC operations have done to keep the critical defect rate low.
Profitability
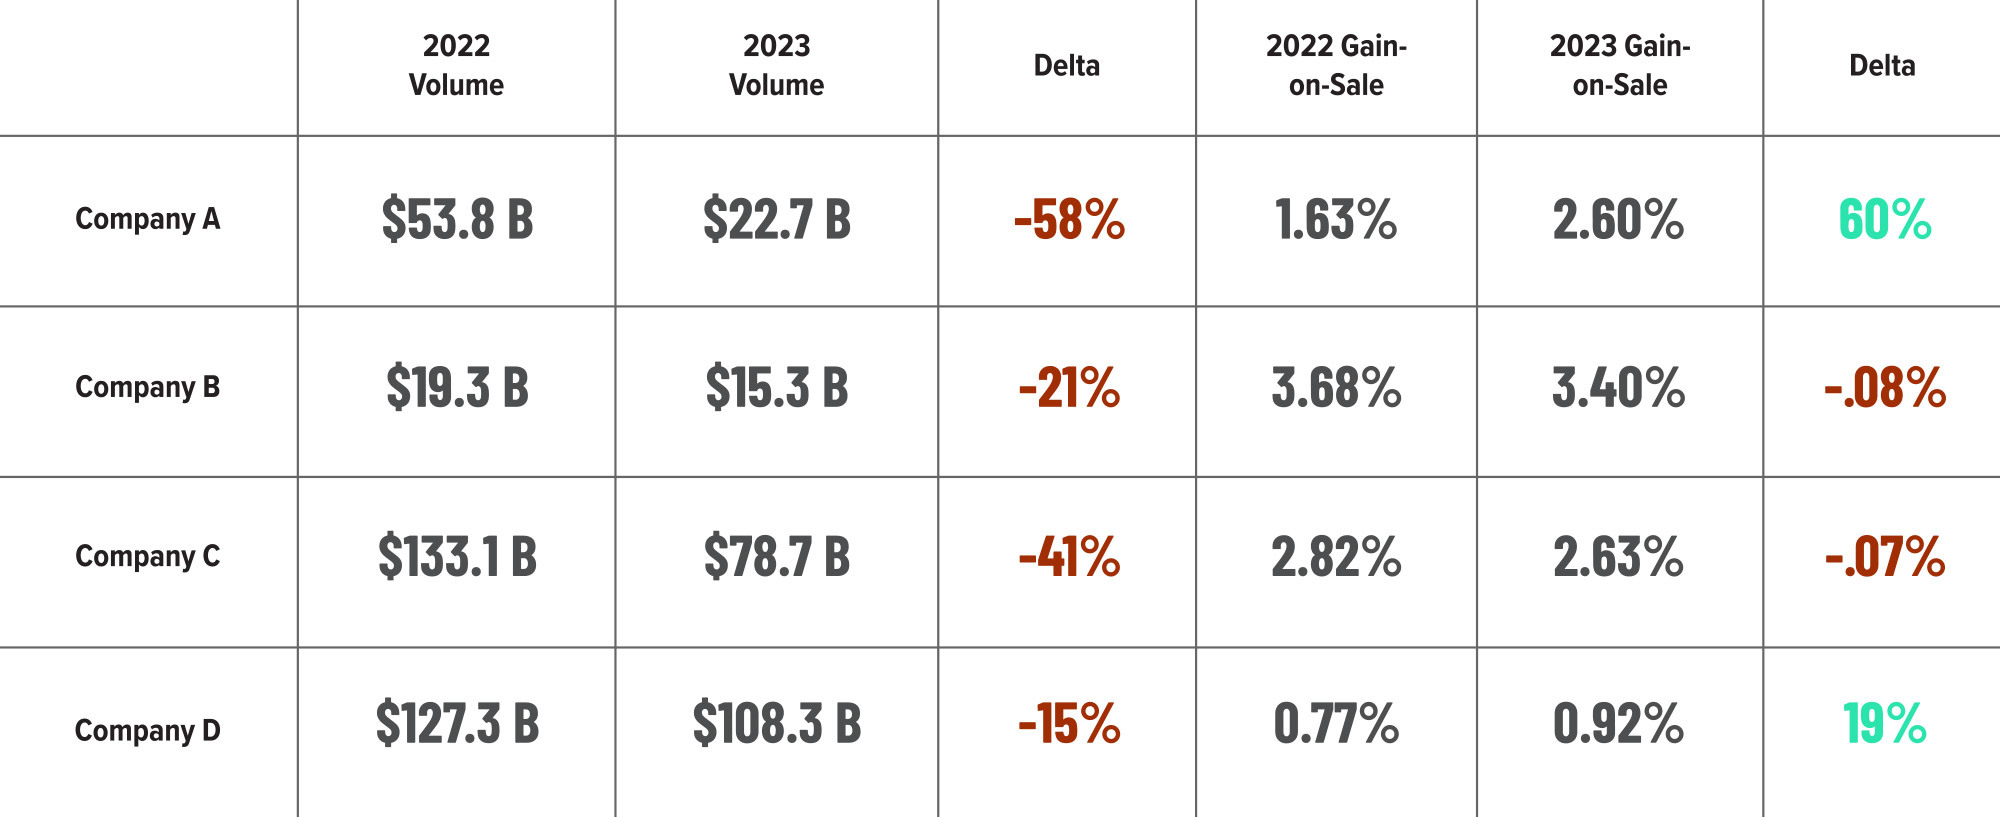
Another area that we watch closely is lender profitability. 2022 was a triple whammy of sorts for lenders, as most increased staff to handle the pandemic volume boom. Rates rose, and volumes dropped quickly and precipitously, so much so that gain-on-sale (a key measure of margin and profitability for lenders) metrics very much worked against lenders. Cyclicality being what it is in our industry, 2023 saw lenders quickly aligning their costs with current volume levels and did get some relief in improving gain-on-sale metrics. SEC filings for several large lenders show that gain-on-sale was flat or even rose in 2023. In some cases, gain-on-sale even approached the levels of 2021. (See below chart for several examples)
Corporate profitability was also markedly improved in 2023. Once again, servicing operations served as an effective hedge against declining origination volume. Most large lenders made hefty profits in their servicing books and were even able to capitalize on attractive MSR values and sell portions of their portfolio to raise cash and improve liquidity. An excellent example of that in 2023 was Mr. Cooper. While this firm originates loans and has ancillary business lines, most of its revenue is related to servicing activities. Mr. Cooper’s stock was up ~62% in 2023 and has skyrocketed even more in 2024 to more than double the 1/1/2023 price. Servicing was very profitable for most in 2023, and Mr. Cooper’s price surge is further evidence that servicing is driving financial performance at all the big lenders.
Conclusion
In 2023, it felt like our industry took one step forward and then one step backward. Although many operations have stabilized, and as the data above shows, profitability and volume are improving, optimism should be met with caution. The industry is still grappling with several large and complex problems. Extreme weather events and natural disasters have wrought havoc on the property insurance market, with some coastal states already in crisis mode. Crucial data providers utilized by lenders –like credit reports and title insurance – are seeing negative headlines and possible regulator attention. The Administration and regulators have found their catchphrase – “Junk Fees” – that resonates with many mortgage borrowers. These topics will impact lenders in the near and medium terms. Solutions will require change, which can mean added costs, disruption and more. So, while the possibility of near-term interest rate easing provides hope, lenders must still be mindful of these large items impacting our industry and the long-tail effects on loan quality and compliance.
About the ACES Mortgage QC Industry Trends Report
The ACES Mortgage QC Industry Trends Report represents a nationwide post-closing quality control analysis using data and findings derived from mortgage lenders utilizing the ACES Analytics benchmarking software.
This report provides an in-depth analysis of residential mortgage critical defects as reported during post-closing quality control audits. Data presented comprises net critical defects and is categorized in accordance with the Fannie Mae loan defect taxonomy.
About ACES
ACES Quality Management is the leading provider of enterprise quality management and control software for the financial services industry. The nation’s most prominent lenders, servicers and financial institutions rely on ACES Quality Management & Control® Software to improve audit throughput and quality while controlling costs, including:
- 4 of the top 5 and more than 60% of the top 50 independent mortgage lenders;
- 8 of the top 10 loan servicers;
- 11 of the top 30 banks; and
- 3 of the top 5 credit unions in the USA.
Unlike other quality control platforms, only ACES delivers Flexible Audit Technology, which gives independent mortgage lenders and financial institutions the ability to easily manage and customize ACES to meet their business needs without having to rely on IT or other outside resources. Using a customer-centric approach, ACES clients get responsive support and access to our experts to maximize their investment.
For more information, visit www.acesquality.com or call 1-800-858-1598.
Media Contact: Lindsey Neal | DepthPR for ACES | (404) 549-9282 | lindsey@depthpr.com
View all reports